Work with the dashboard Trend Viewer
Start Trend Viewer
You start the Trend Viewer from a superposed dashboard or a Plant Dashboard:
- Left-click a chart:
- Display Trend Viewer
- Display Trend Viewer in a new tab (recommended for detail analysis)
Trend Viewer functions
 displays the Trend Viewer in full screen mode.
The Trend Viewer has the following, listed functions:
- The initial view in the Trend Viewer matches the setting on the dashboard.
- Two time bars:
- Top: Exact selection area with high Y axis resolution.
- Bottom: Selection range on a timeline with a small Y axis resolution.
- Setting the depicted timeframe: Time window with number / Time unit / End / Calendar function.
- Now button: Timeframe end is the current time.
- Restore button
 after manual zoom.
 - Zoom.
- Scroll to previous/next time section, shift a selection (below only)
- Ruler with values box to capture values on the ruler position.
- Disable/enable data point series: Click the key.
- Export data point series to csv format (one file per data point series):
- With the export icon
 , the written, set timeframe.
 - With button
 , the manually selected zoom range.
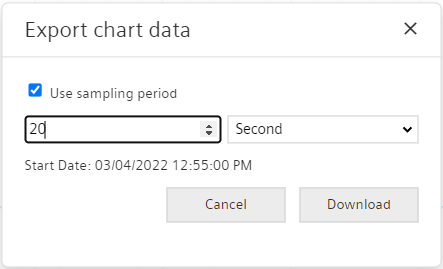
 - Export data point rows in csv format (multiple data point rows in a file):
- Multiple values or trends can be exported.
- Use symbols or to export.
- Select the 'Export sampling period'.
- Indicated the sampling period:
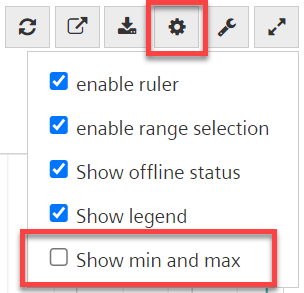
Additional buttons
| Refresh the view |
| Show and hide elements of the Trend Viewer Note: A large number of minimum and maximum values significantly impacts system performance. As a consequence, 'Display min and max' is disabled by default.
|
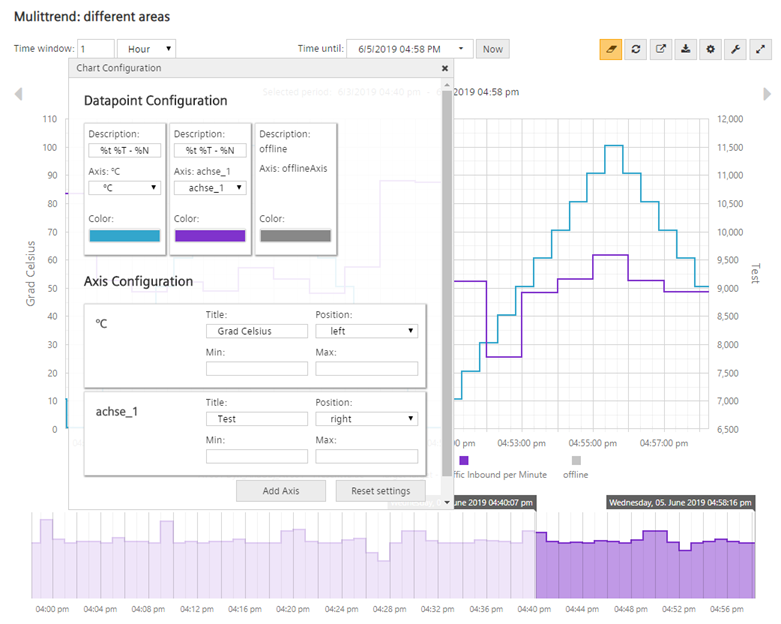
| As a supplement to fixed settings in charts (Dashboard Editor), the chart can be finely tuned in the Trend Viewer. The specific operator can make modifications directly in the Trend Viewer to optimize analysis of the data series:
|


NOTICE

Edit charts
Whereas the settings in "Edit tile" remain fixed on the diagram, any fine tuning in the Trend Viewer using  remains only in the browser for the specific user and only for the applicable diagram.