Setup and operate a multichart tile

"Create and edit User Dashboards" describes how to create charts on the dashboard.
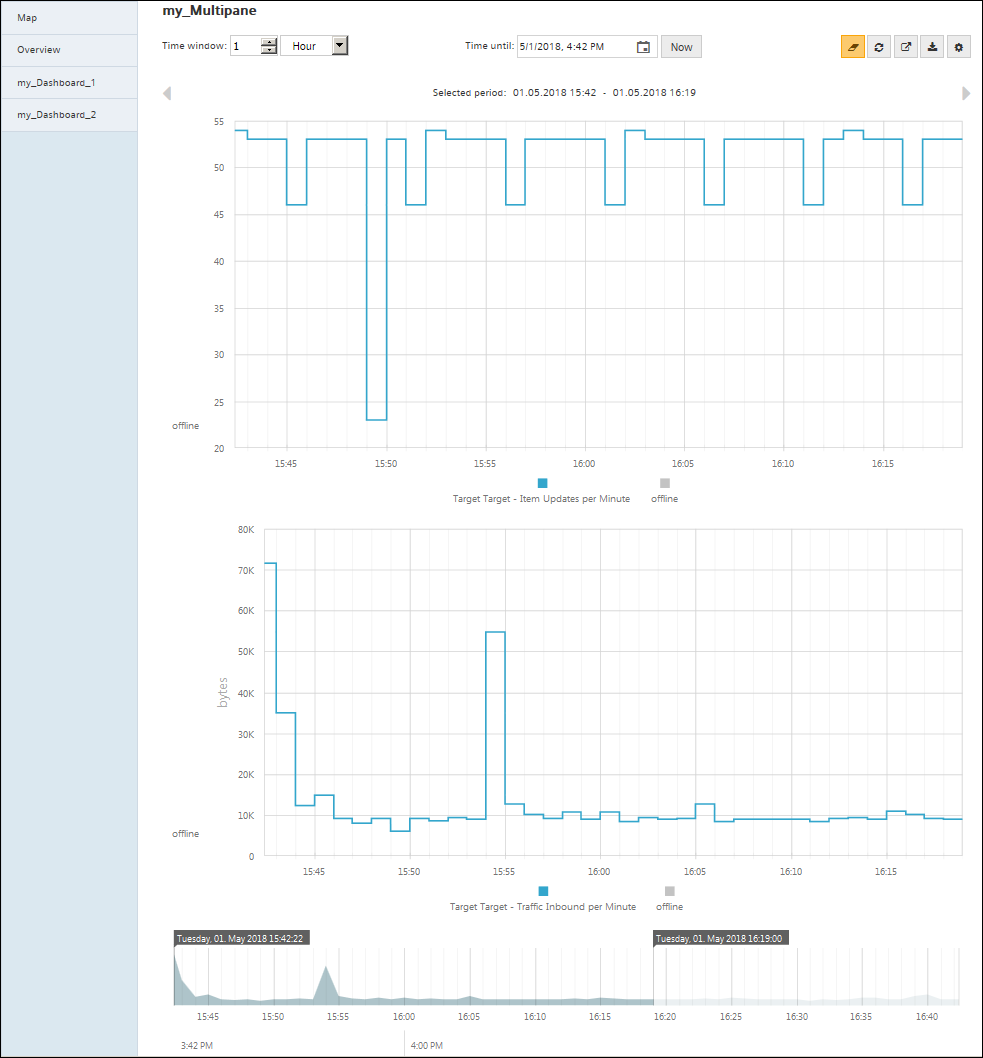
A multichart tile is a tile that includes multiple line charts. Readability and client performance are the only limits to the number of charts.
The Trend Viewer for the 'multichart tiles' displays a stacked view of the integrated line charts. This has the following benefits:
- Common settings for the monitoring period.
- Common data export.
- In the stacked view, interactions and differences in data are easier to identify than on individual charts.
Proceed as follows to create a multichart tile:
- At least 2 line chart tiles, each with data points, are created on the dashboard.
- Go to the Dashboard Editor.
- In the workspace, left-click and select 'Add Tile'.
- Select 'Multichart Tile'.
- Design the 'multichart tile' to meet your needs (title, legend, orientation, etc.).
- Drag both diagrams to the 'multichart tile'.
- Select a data point tile.
- Drag the tile per drag-and-drop to the 'Multichart tile'.
- Highlight the multichart tile and check with "Edit Tile" if both charts were actually set up.
- You can change the sequence of the charts here.
- Save and export your dashboard.
- Return to the dashboard view.
- Right-click 'Multichart Tile' > Trend Viewer (recommended: in a new tab) to start Trend Viewer.
- The view is similar to the figure on the next page.
Hint
Make sure that only one tile is highlighted to edit it.