Key performance indicators (KPIs)
The Map home page displays the geographic position of your plants or systems together with a color code that reflects a KPI↑ (Key Performance Indicator). Intuitive, the color green represents an OK state, yellow for warning, and red means the indicator is not OK.

You must define the longitude/latitude of your plant or system for it to appear on the map. See "System settings".
KPIs for systems and plants
KPIs can be set up for systems for plants. The corresponding setting is made on the KPI level (see below, section “Syntax for KPI data point ranges").
Depending on the selection, a KPI is displayed automatically on the dashboard on the map for system or on the map for plants.
Normal data point IDs are used for system KPIs. Specific system tokens are not required.
Step-by-step guide to setting up a KPI
A system or plant data point is selected below on the SCOPE project and defined as KPI for the "Map".
In the SCOPE tool
- The SCOPE tool is open with the project loaded on the target controller.
- "Browser for Data Points" is open.
- In the 'Browser for Data Points', go to a data point that can accept multiple states (multistate) and is available and typical for all plants or systems in the Tenant space.
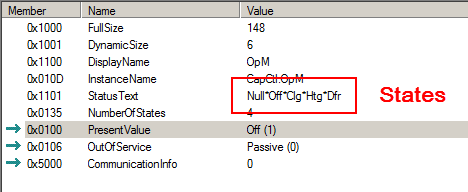
The 5 states in the example have one-up numbers 0…4 that can be addressed in the KPI.
- For example, drag-and-drop the PresentValue of the selected data point to a watch page prepared for the KPI.
- "Edit Watch Item" displays.
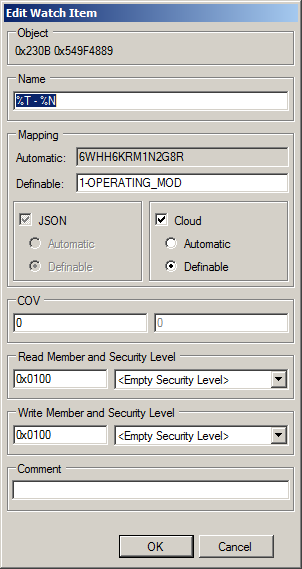
- Ensure that "Definable" is selected under "Cloud". Thus the entry is considered for Definable.
- Modify the entry under definable as needed.
- Save the watch page.
- Double-click GenericCloud to force a change marking in Mapping Support, indicated by a small star.
- Save Mapping Support.
- Check the date in the loader of the mapping file. It must be up-to-date.
- Stop the application, load the mapping file, and restart the application.
In Climatix IC
- You have the portal role↑ Tenant-Administrator↑.
- Go to "Administration > Tenants↑ > 'my Tenant' > Pane: Key performance indicators".
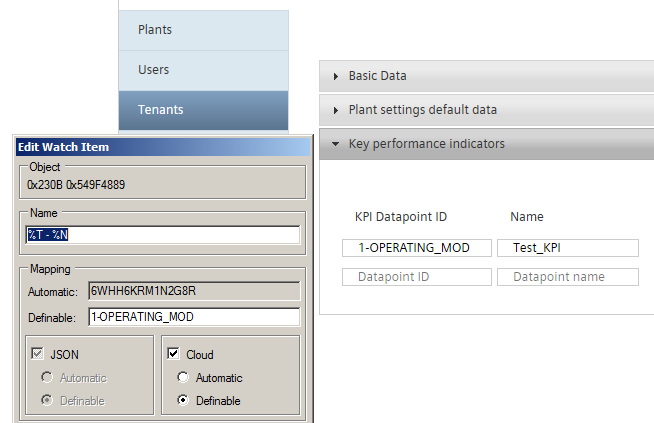
- Transfer the definable entry from SCOPE to "KPI Mapping ID" in Climatix IC.
- Name the KPI appropriately.
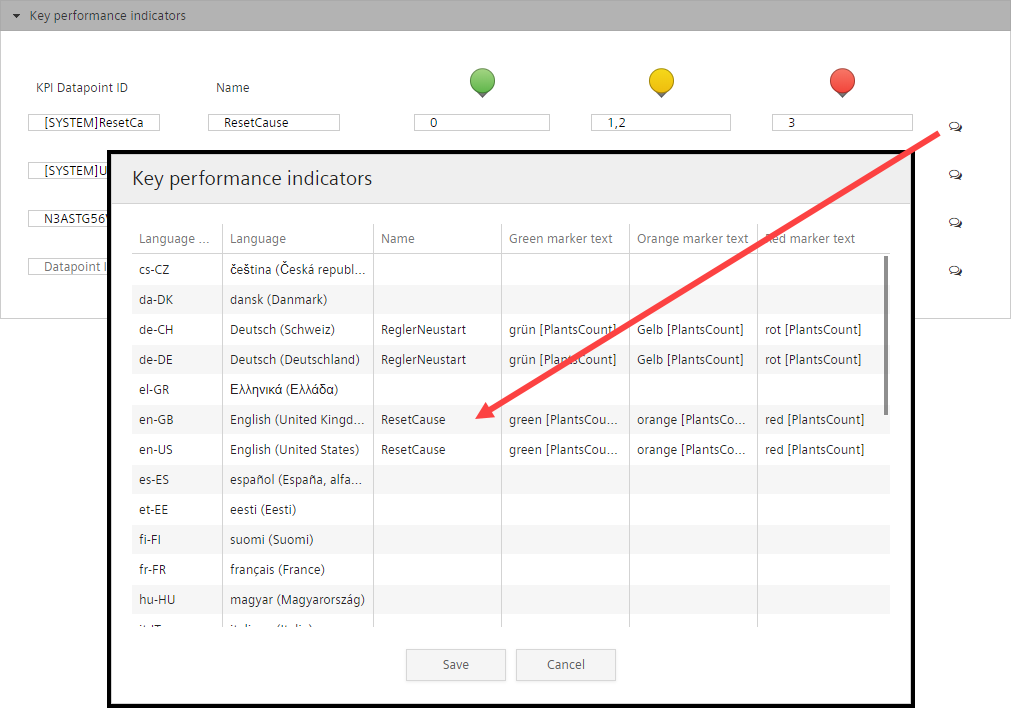
- Click the symbol "Edit all languages", to translate the KPI names on the right side in all desired languages. For translation, you can use the token↑ [PlantsCount] that displays the number of plants or systems.
- Assign the data point states to the KPI states (see the next Section).
- Save the KPI entry.
Result
- Go to "Dashboards > Map".
- In the KPI list box (top right), select your configured KPI.
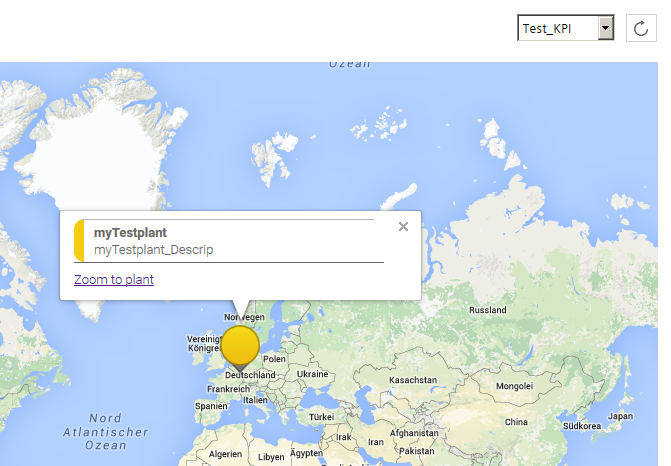
- All plants or systems with geographic coordinates are displayed on the world map showing the data points for the KPI.
Tip: Switching between various KPIs can result in an unfavorable map section. Press Ctrl + F5 to display the updated version of the world map and data.
Syntax for KPI data point ranges
The following graphic illustrates how easy and flexible it is to configure ranges for the KPI.
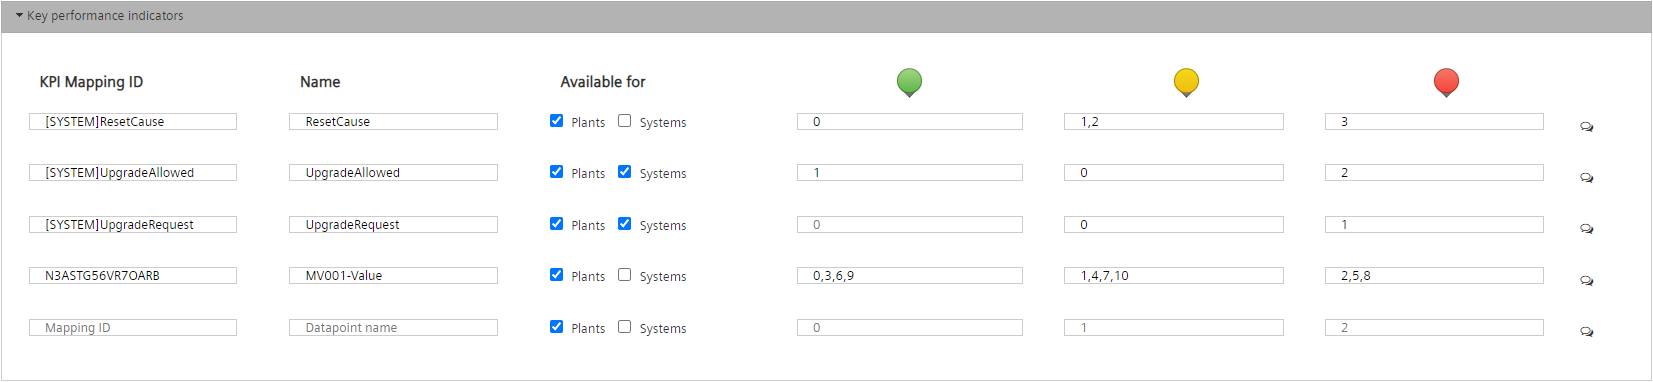
Address system data points
Always use the following syntax to address system data points:
System data point | KPI data point ID syntax |
|---|---|
Target - ResetCounter | [SYSTEM]ResetCounter |
Target - SD:CardIn | [SYSTEM]SDCardIn |
Target - OperationalTime | [SYSTEM]OperTime |
Diagnostic - MSRFailure | [SYSTEM]AppFail |
Diagnostic - MSRFailureType | [SYSTEM]AppFailType |
Diagnostic - ResetCause | [SYSTEM]ResetCause |
CSL-Config - UpgradeAllowed | [SYSTEM]UpgradeAllowed |
CSL-Config - UpgradeRequest | [SYSTEM]UpgradeRequest |
Translate KPIs
KPIs can be translated. The following graphic outlines how to go to the translation menu:
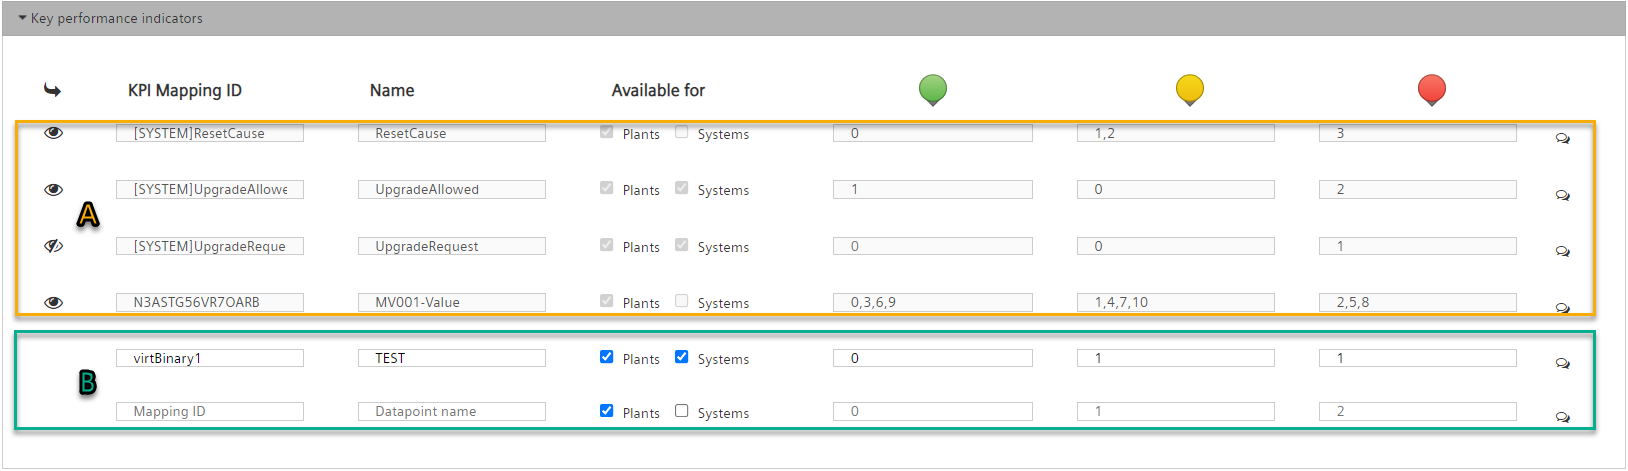
Inherit KPIs from Main-Tenant and Sub-Tenant
All KPIs are inherited as a rule from the Main-Tenant to the Sub-Tenant.
- The inherited KPIs are displayed in the Sub-Tenants with as read-only values.
- The inherited Main-Tenant KPIs are grayed out (A).
As of D19, you can select or clear automatic inheritance within the Sub-Tenant. A KPI that is cleared from the Main-Tenant is hidden in the Sub-Tenant.
- The KPI is grayed out, preceded with an icon
 or
or  .
.
- Click to hide a KPI.
- The icon switches to .
- The KPI is hidden in the Sub-Tenant.
- The KPI is hidden on the map in the 'Dashboard' menu.
- Click to show a KPI.
- The icon switches to .
- The KPI displays in the Sub-Tenant.
- The KPI is displayed on the map in the 'Dashboard' menu.
In addition, you can create your own KPIs that are independent of the Main-Tenant.
- KPIs that can be edited are displayed in black font (B).
- Set up a KPI as previously described in paragraph 'Set up a KPI step-by-step'.
- The new KPI is displayed on the map in the 'Dashboard' menu.
A maximum of 20 KPIs can be created or inherited per Tenant.