Pie chart: Display value in color
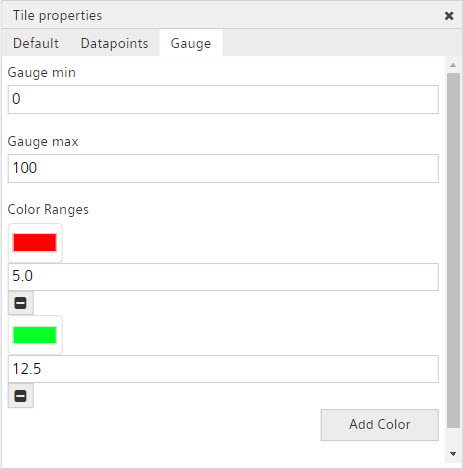
You can assign specific colors to the bar gauge:
- Go to 'Tile properties > Display'.
- Click 'Add Color'.
- Click 'Color Ranges' and select a color.
- Enter a value in the field as the starting point for display the selected color in a pie chart.
- The color in the pie chart changes to the preset color as soon as the entered value is reached.
- Repeat the process to enter various colors at different values.
NOTICE

Token support
All diagram entries that define a display field for a tile, offer token support. Available tokens↑ (including an explanation) are offered automatically. The following are available:
- Climatix IC tokens specific to a plant, for example [SiteName], [SiteAddress], etc.
- Data point-specific controller tokens (%t, %T and %N)