Edit dashboard properties
The 'Chart size' function in the 'Dashboard properties' menu window adapts the chart on the dashboard to the browser window:
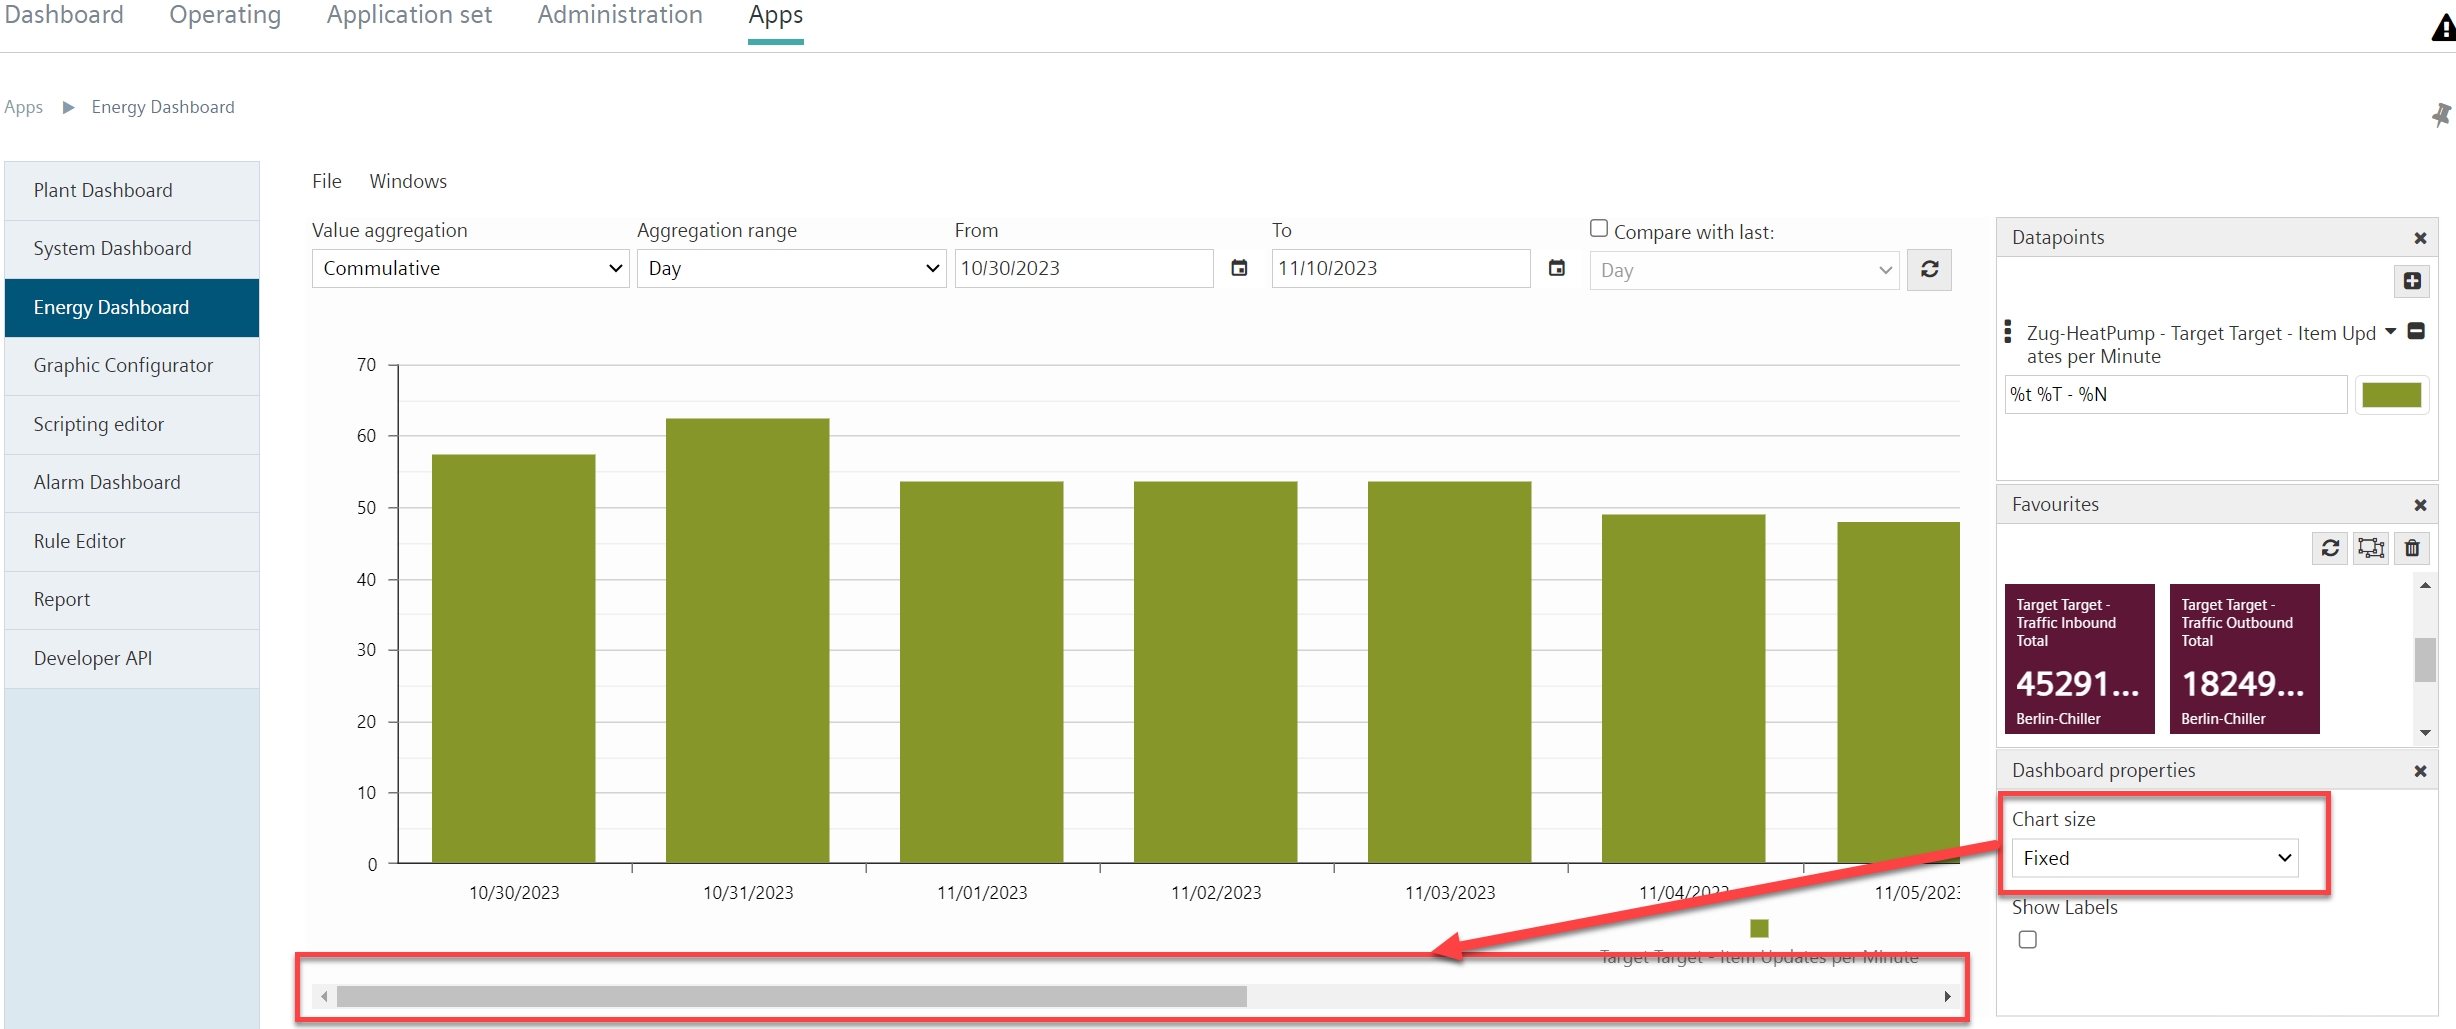
- Select 'Fixed' from the drop-down menu under 'Diagram size'.
- The diagram retains its size in the dashboard regardless of the size of the browser window.
- All results are displayed in a fixed standard width.
- For wide diagrams, a scrollbar appears at the bottom of the table to scroll the entire width of the diagram.
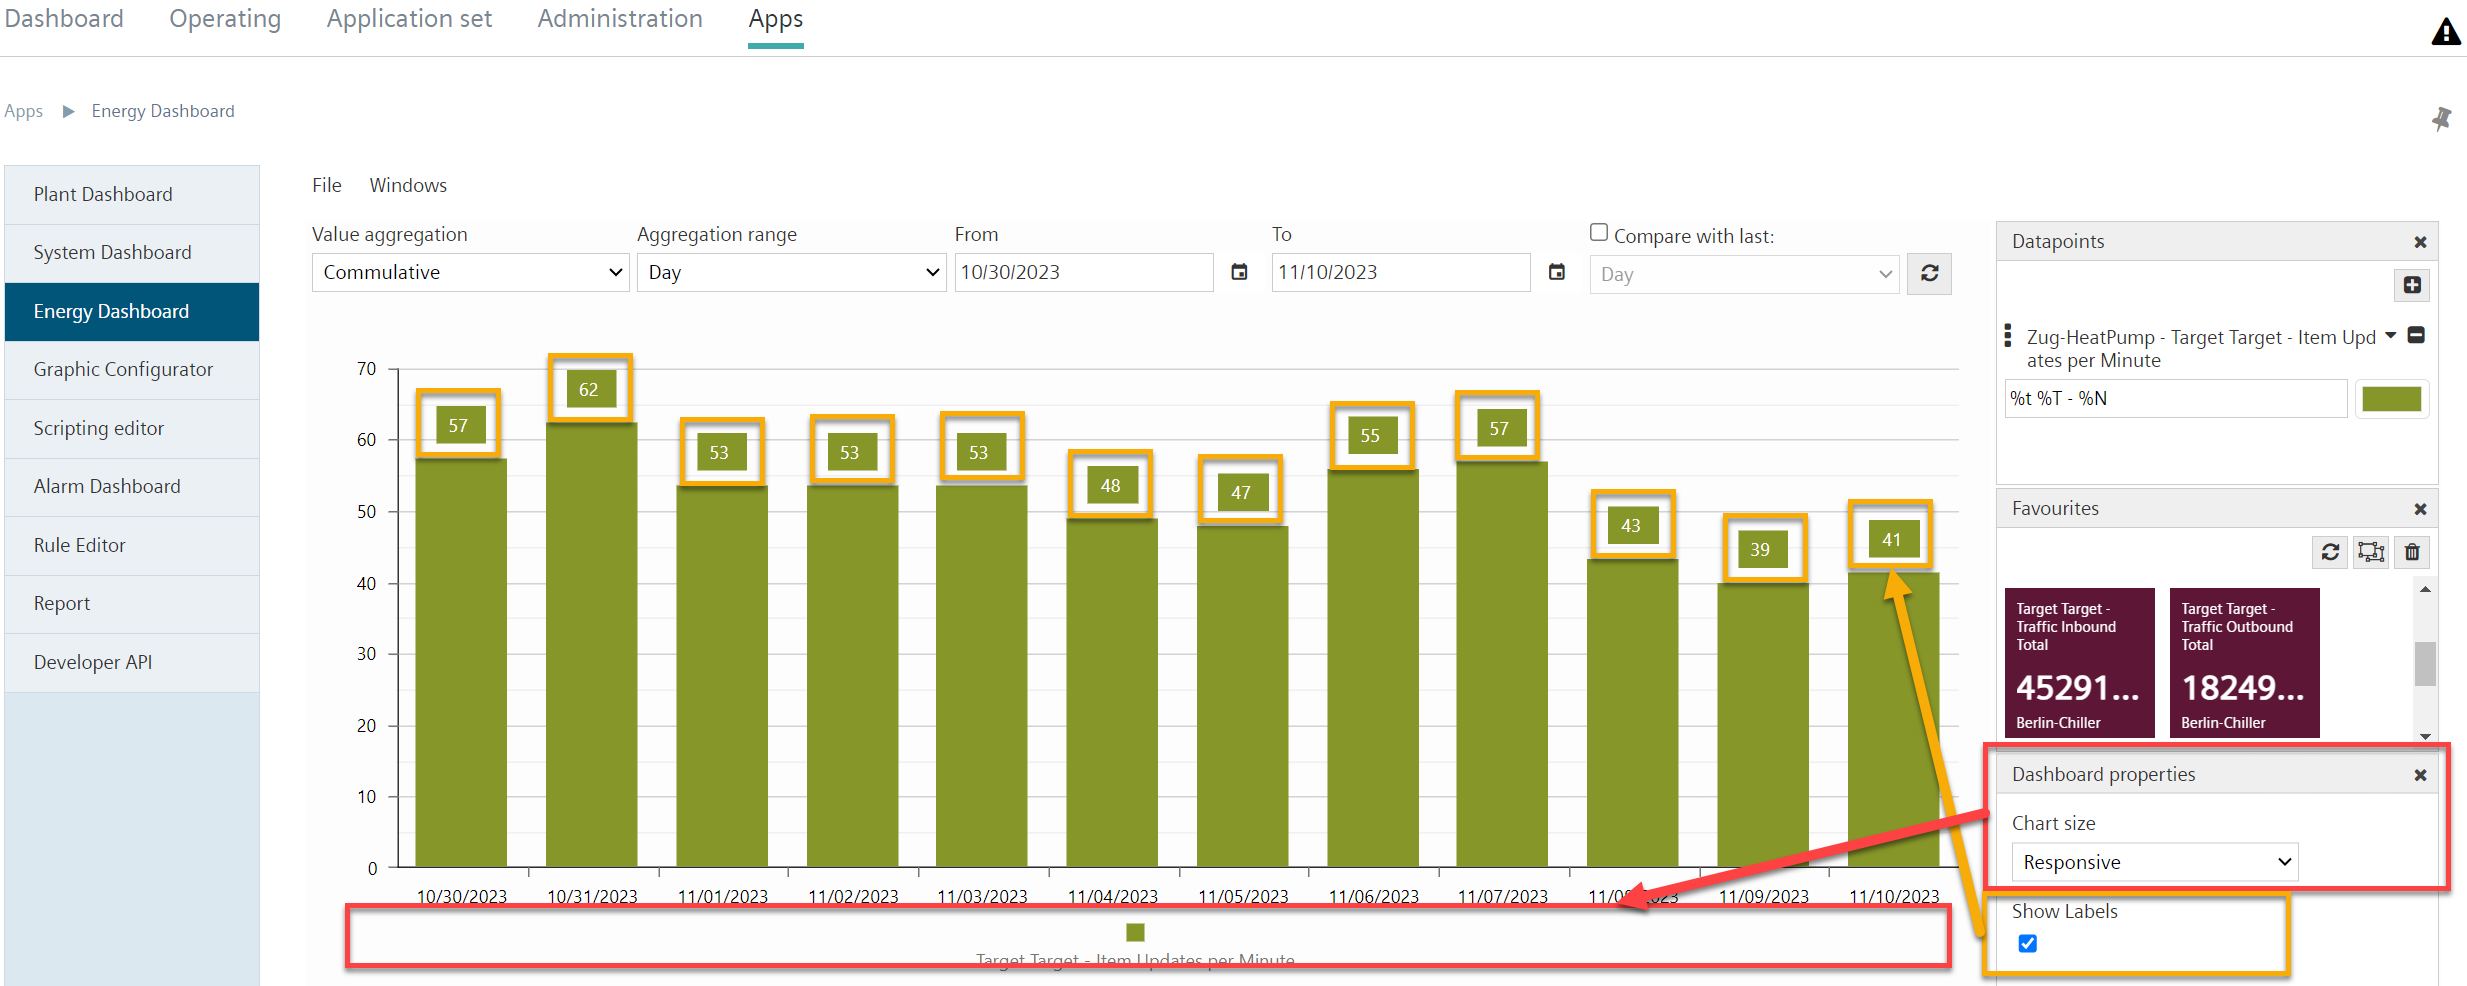
- Select 'Responsive' from the drop-down menu under 'Diagram size'.
- The diagram in the dashboard adapts to the width of the browser window.
- The diagram is displayed with its results adapted to the width of the browser window.
- The complete diagram can be viewed at a glance.
- In the 'Dashboard properties' menu window, select 'Show labels'.
- The values of the data points are displayed as text in the diagram.
- In the 'Dashboard properties' menu window, clear 'Show labels'.
- The values of the data points are hidden from the diagram and can only be read from the legend at the edge of the table.