Select data point display period
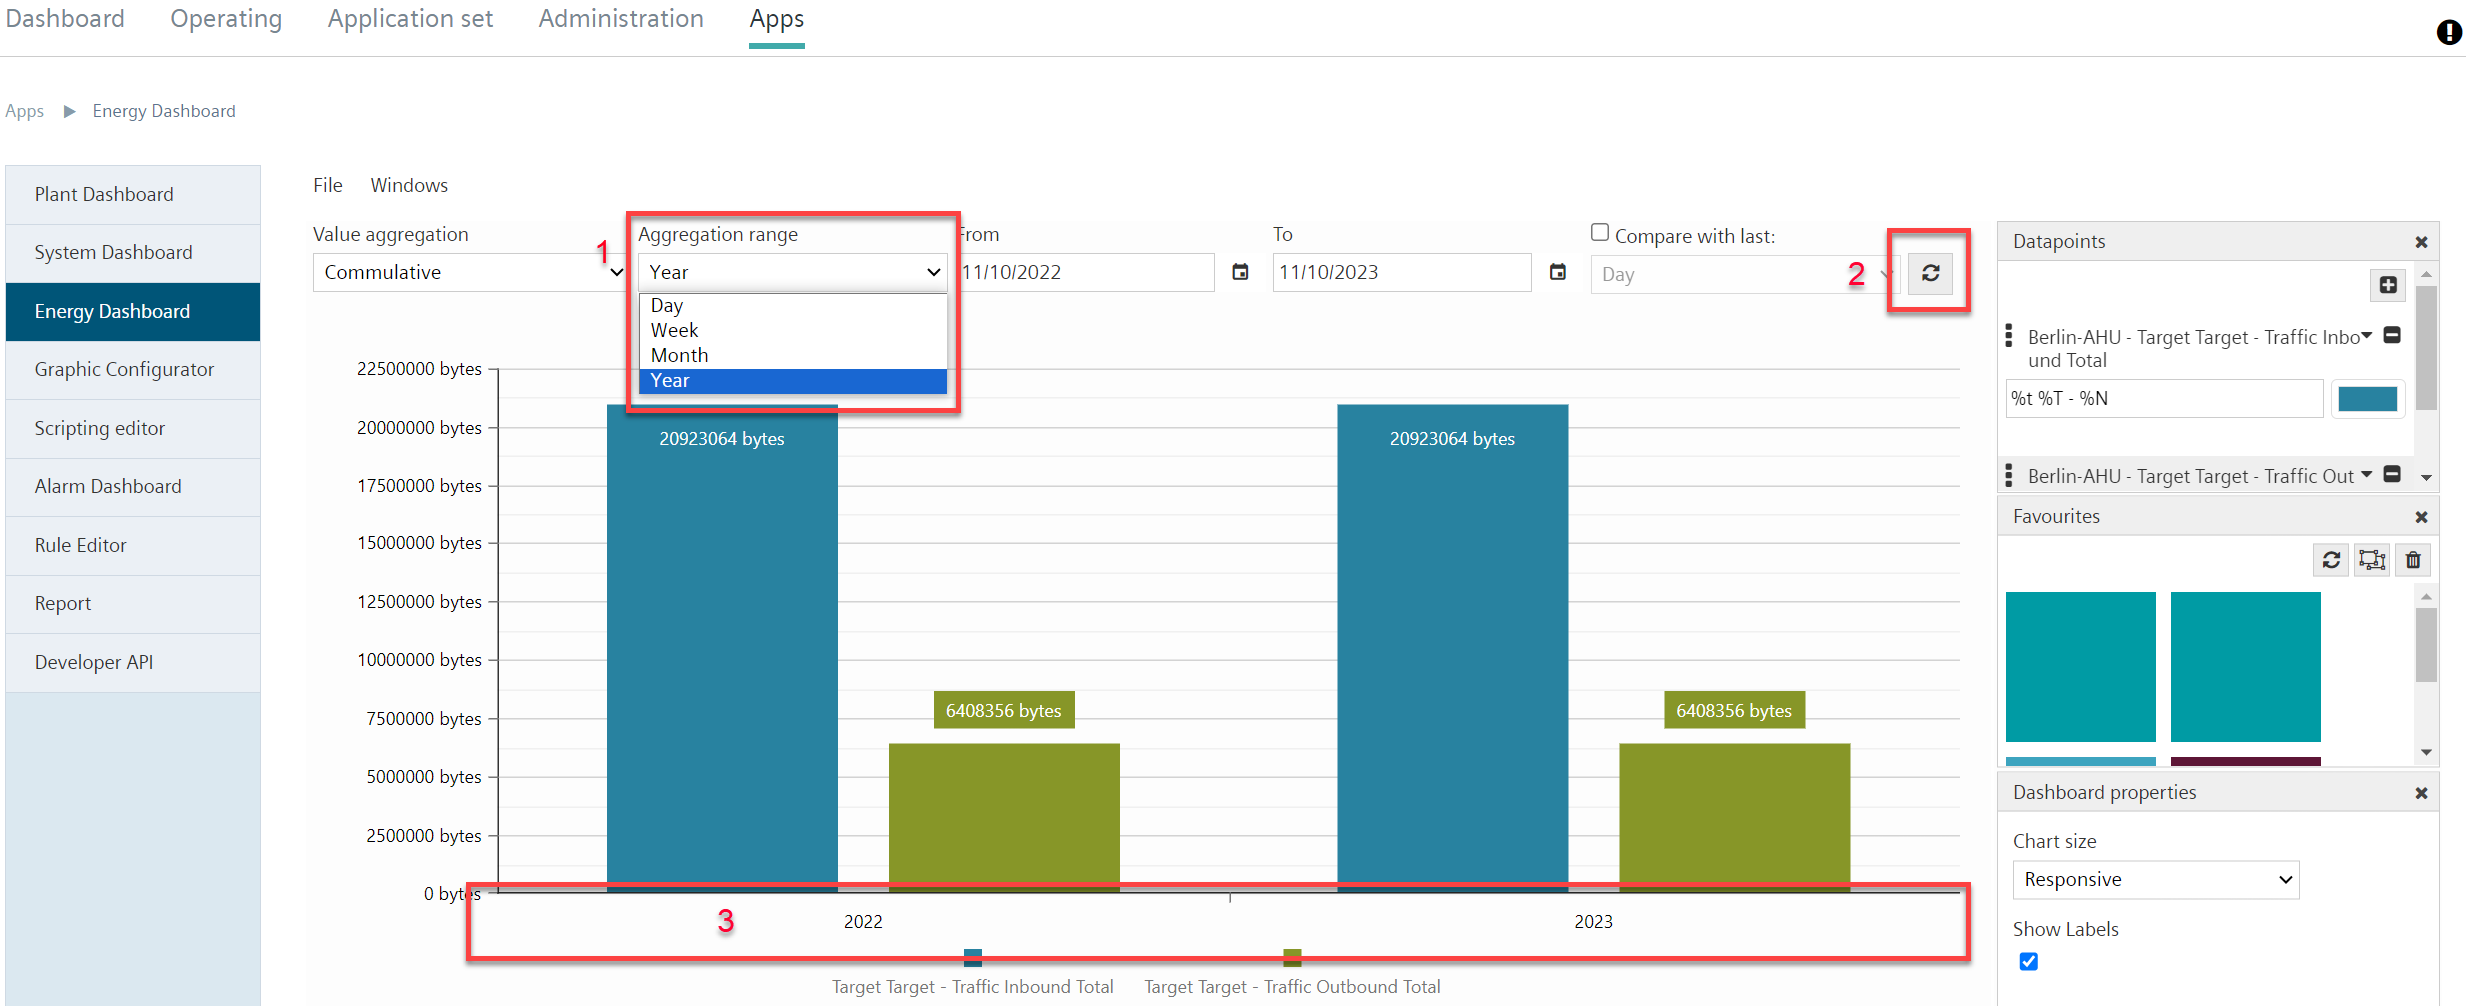
Aggregation period:
- Go to "Aggregation area".
- In the drop-down menu (1), select the desired period for displaying the collected data point values.
- Select "Update" (2) to apply the changed settings in the bar chart.
- The display period in the diagram displays accordingly (3).
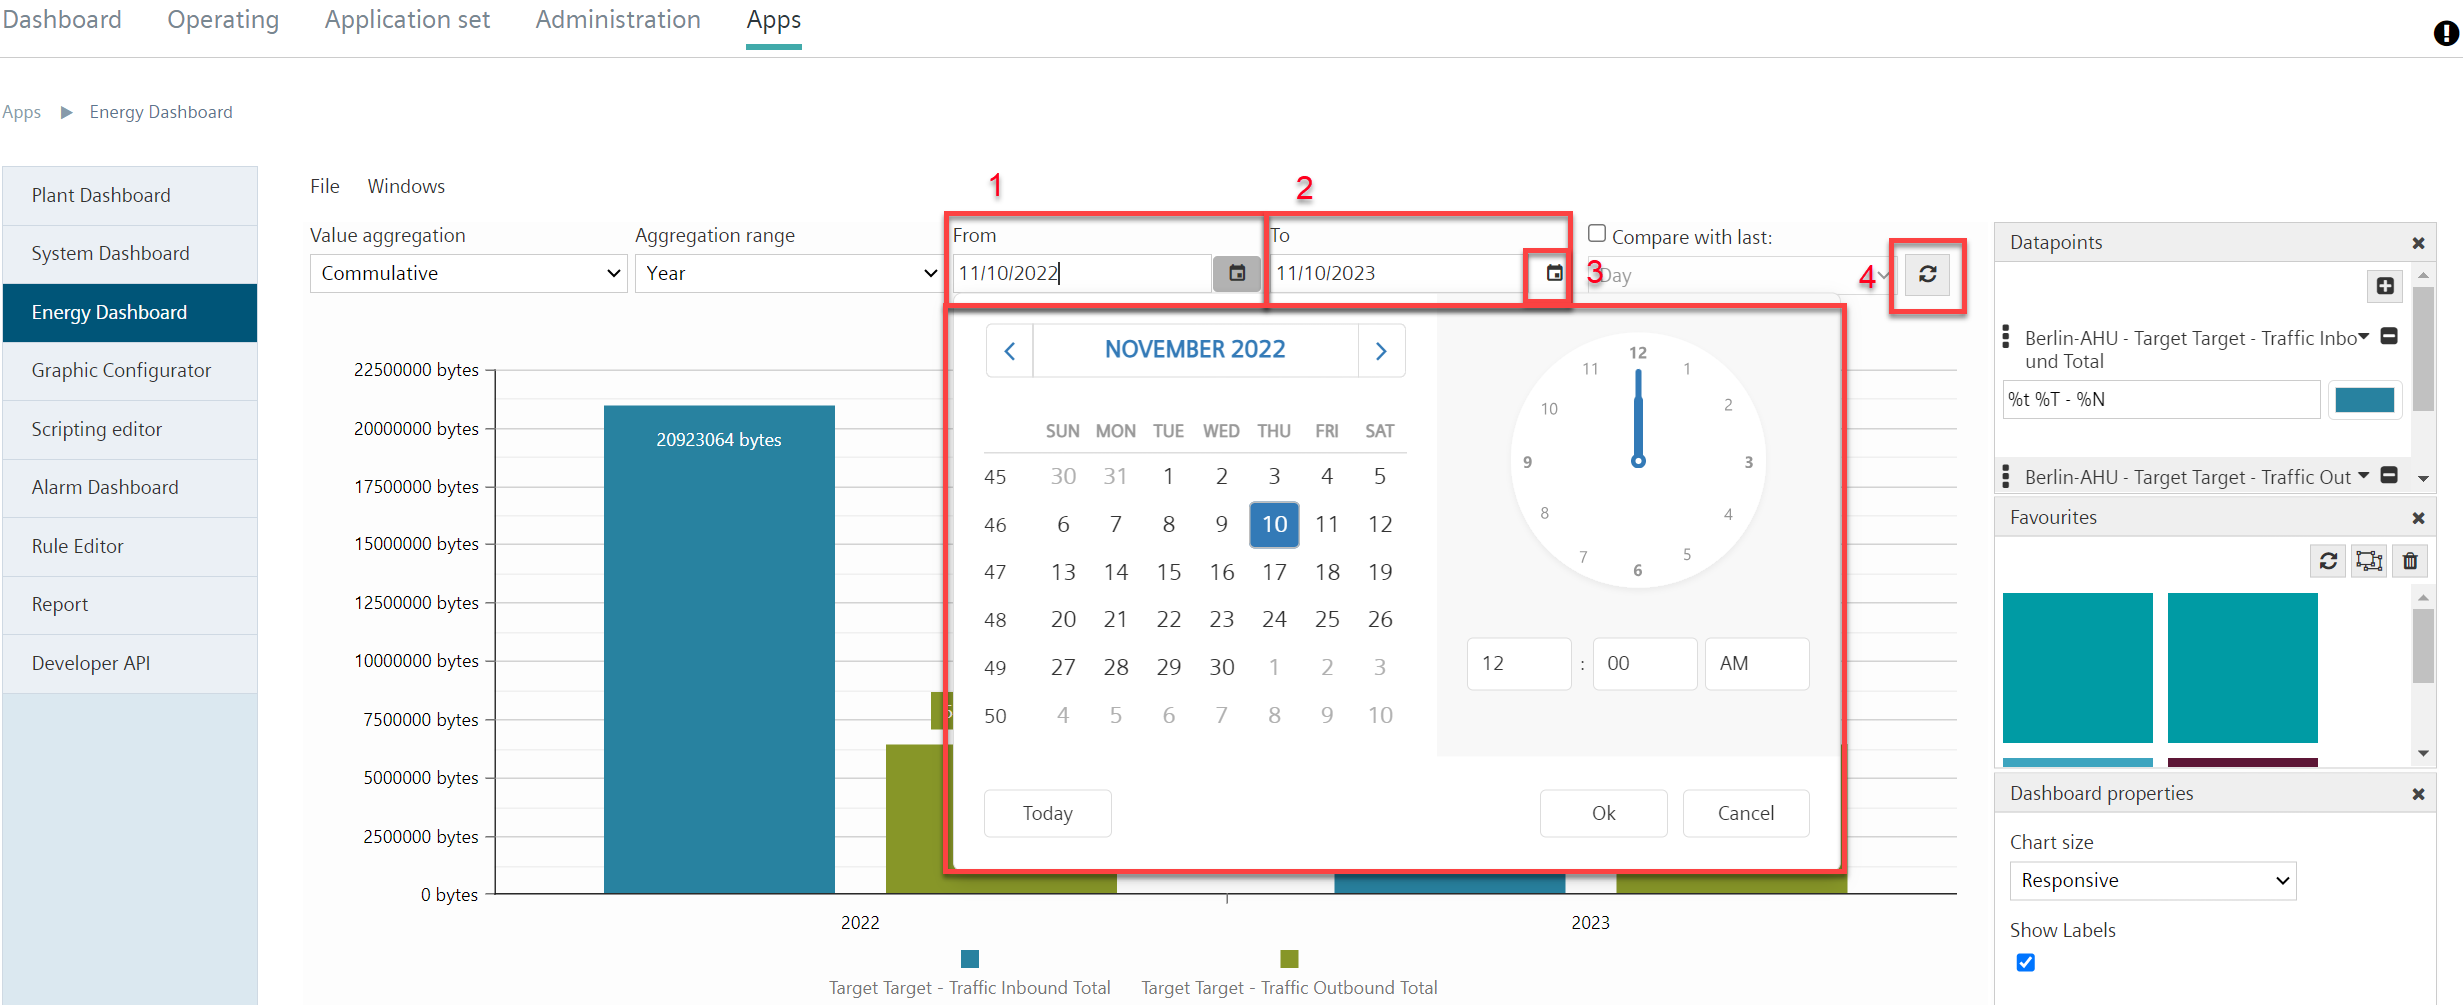
Manually set the period:
- Manually enter the start time of the value series in the "From" date field (1).
- Manually enter the end time of the value series in the "To" date field (2).
- Alternatively: Select the start and end time with date under
 in the drop-down menu (3).
 - Select "Update" to apply the changed settings in the bar chart (4).