Scaling data point values
A simple conversion can change how data points display in diagrams. Data points have a multiplier available in the dashboard editor. It can display the real data as transmitted by the plant by a factor x in the dashboard.
The function can be used, for example, to:
- Convert a negative value to a positive value.
- Increase the size of a very small value in a diagram.
- Decrease the size of a very large value in the diagram.
- Convert a value to another unit, for example, Wh to kWh.
- Go to a data point tile.
- Select 'Data points'.
- On the data point, expand the menu by clicking ▼.
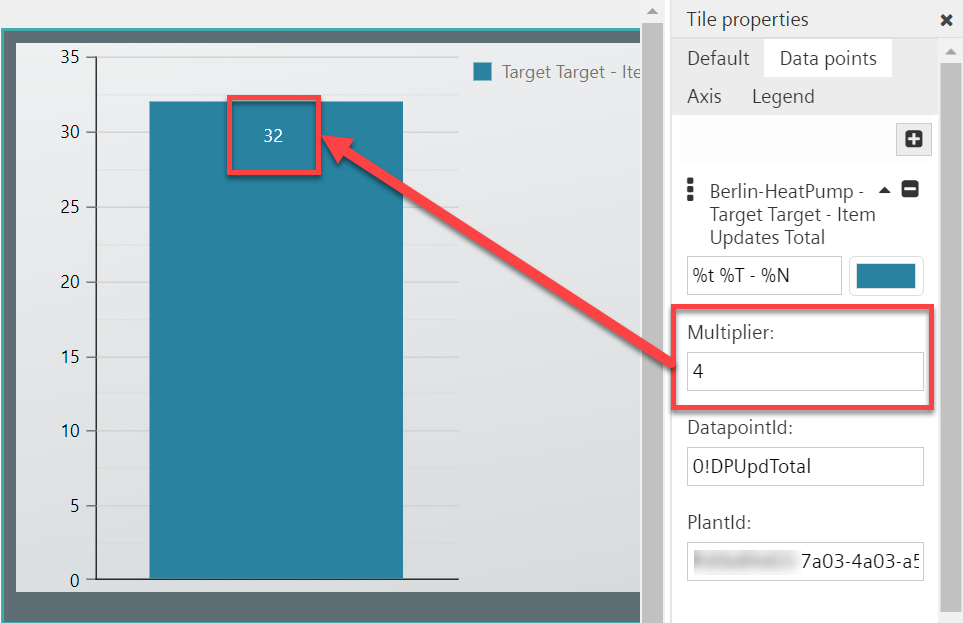
- Enter the multiplier for the data point in the 'Multiplier' field.
- The data point is multiplied by the multiplier and displayed to the new size.
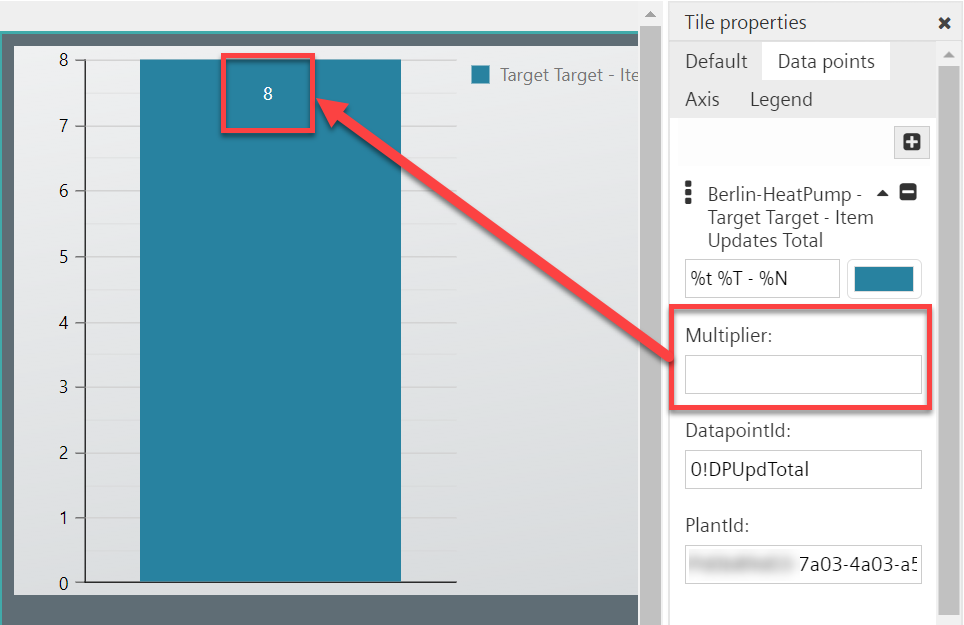
- The new value is used for display on the dashboard and web graphic but has no effect on the original values.
No multiplier:
With multiplier: