Play back web graphics using dynamic cloud item values
A web graphic can integrate and display dynamic values from Cloud items↑. The values in the graphic change over time through Cloud item updates↑.
The web graphic can be replayed using the playback function to track the values in the graphic.
- The own role is 'Tenant-Administrator’ or 'User '.
- Or: The User role↑ is assigned the privilege 'Plant / History replay (Web graphic)' (see 'Roles').
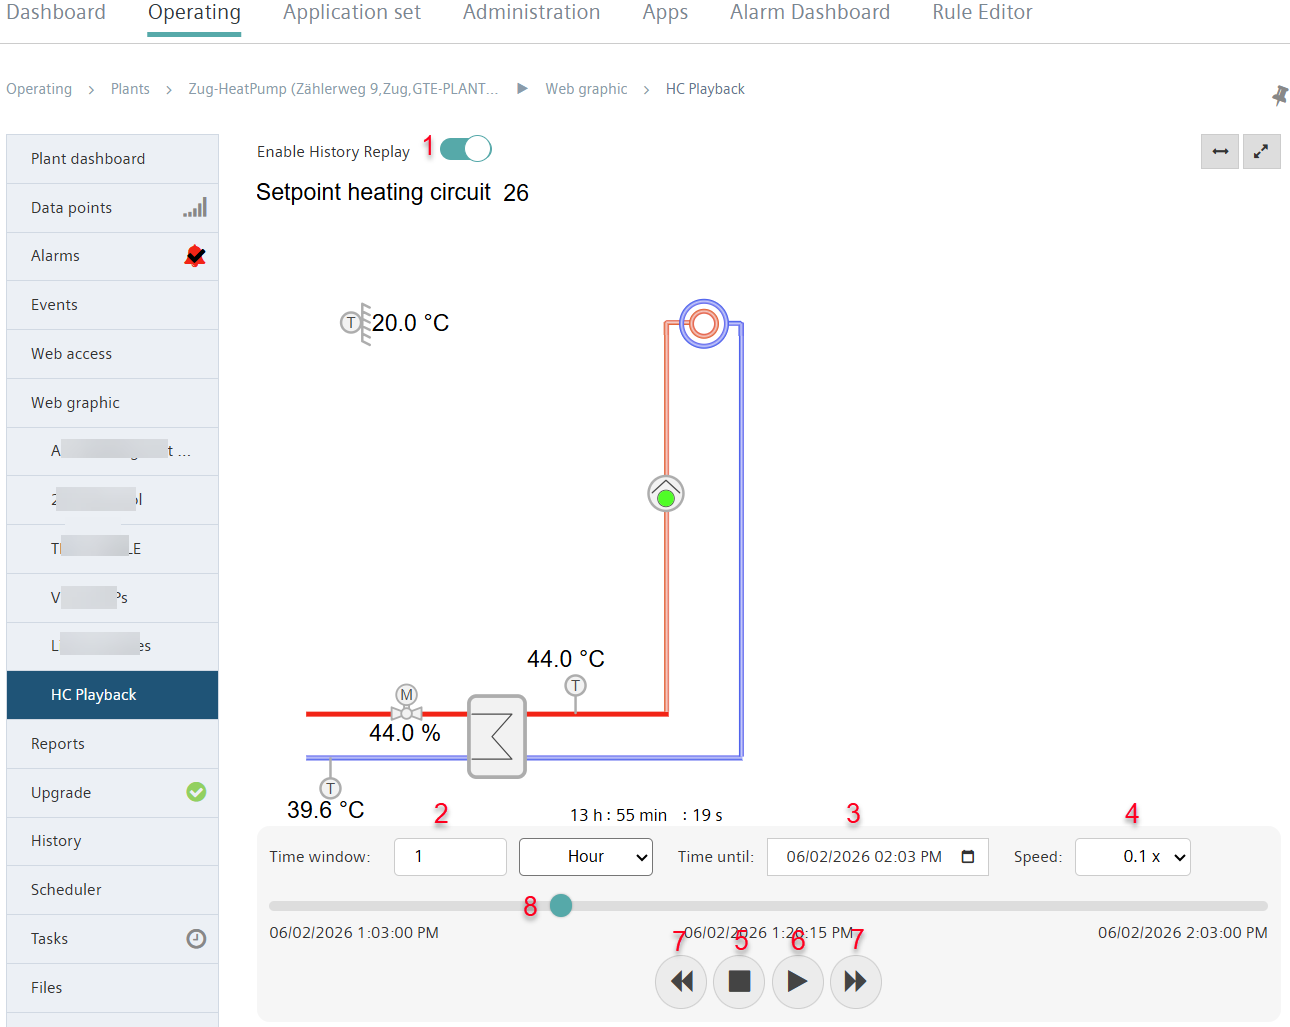
- Go to 'Operation > Plant > [My plant] > Web graphic > Playback'.
- Select 'Enable History Replay' (1).
- Select the length of the time steps (2), displayed time period (3) and playback speed (4).
- The operating panel can start (5), pause, reset (6), move forward or backward one step at a time (7).
- Select the time for display on the timeline (8).