Dashboard
The dashboard is your personalized Climatix IC start screen. The dashboard is divided in:
- Map: Displays the geographic location of your systems and plants together with a configurable KPI↑ (Key Performance Indicator).
- Overview: The plant overview as configured by you includes your "Favorites" as tiles, similar to the desktop on your PC.
'Dashboard > Map'
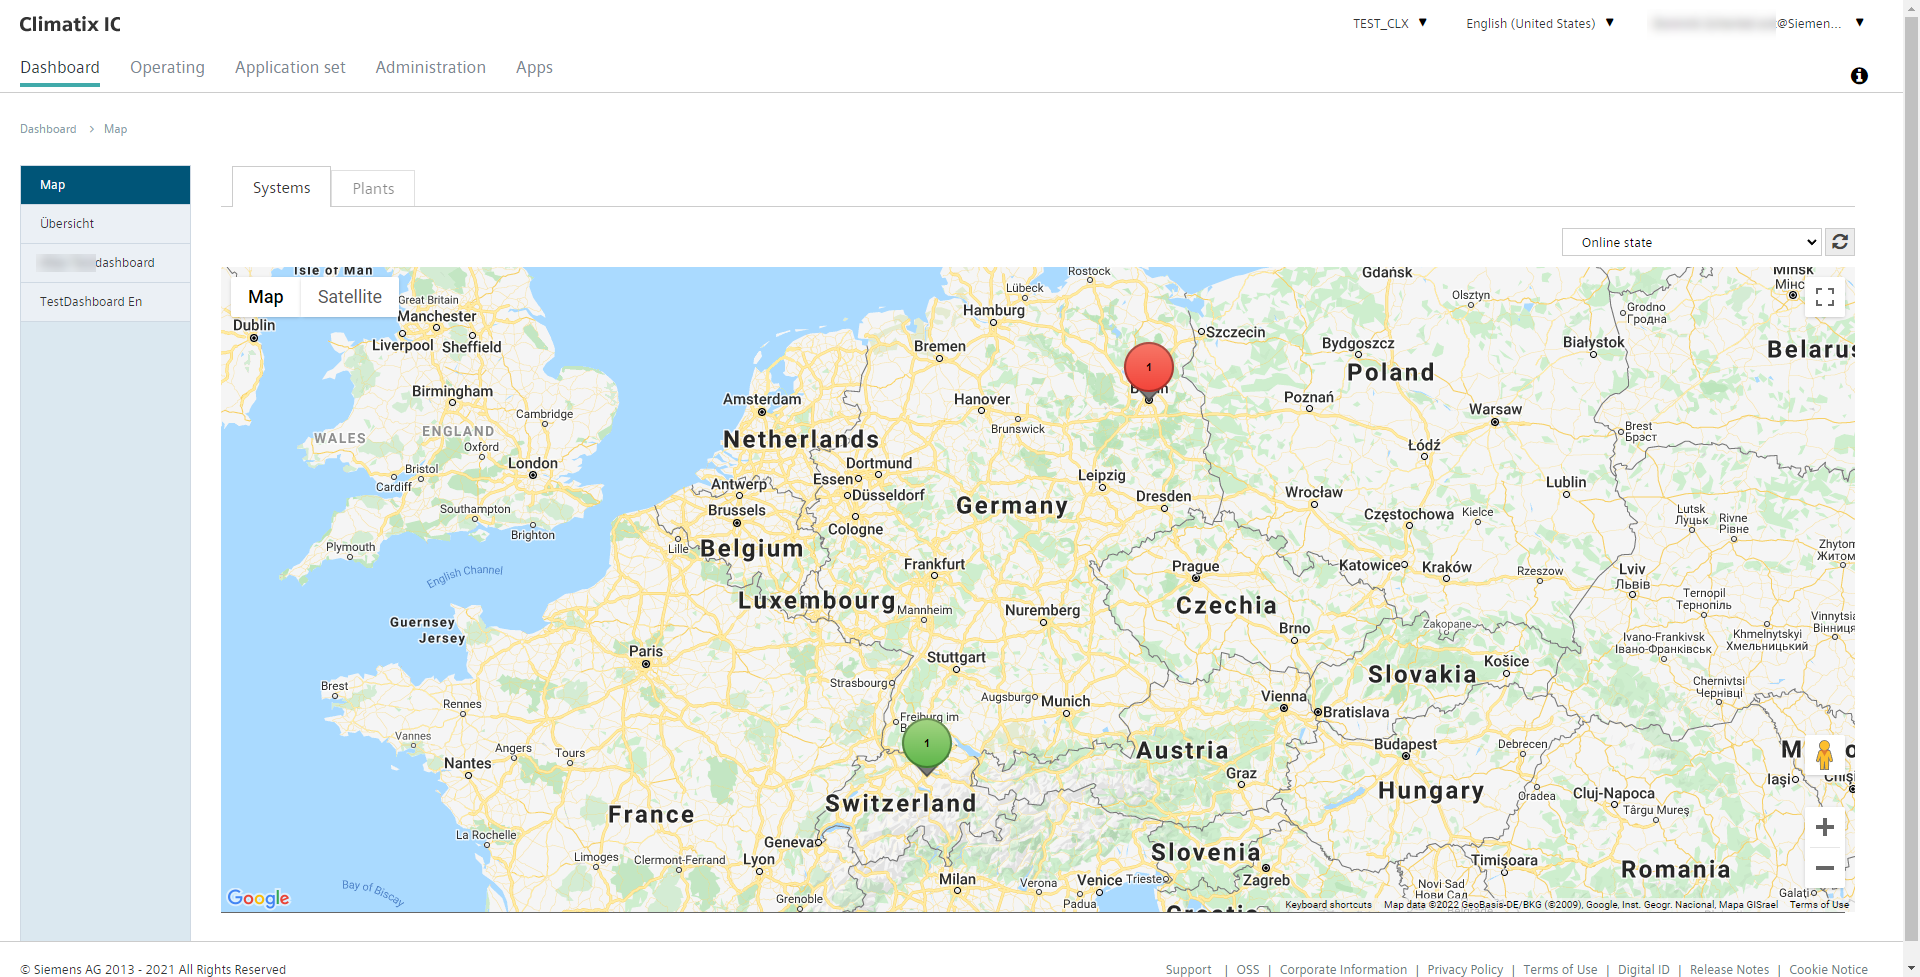
- Each available for systems and plants.
- Display in separate tabs.
- KPIs for systems and plants are integrated exclusively in the assigned maps.
- Street and satellite information is provided by Google and offers supplemental information for service calls.
- It goes directly from the map to the data points and settings.
- Your plant's online status is the first KPI by default. Additional KPIs define a user with administrator rights with just a few clicks.
Additional information
You can learn how to create a KPI with just a few click in "Tenants", the sub-section on Key Performance Indicator.
'Dashboard > Overview'
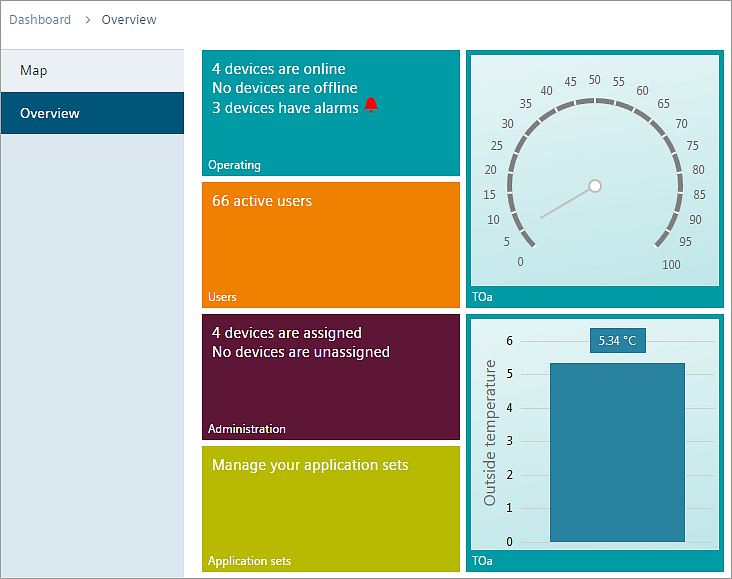
- The tiles include your quick links to menus, your most important values in graphical or numeric displays, entire web graphics or trends started in a powerful Trend Viewer.
- Compile these elements in Dashboard editor for plants and systems and export them to the Dashboard overview.
Default tiles
The following menus are displayed by default (but limited by privilege) as default tiles: Operation, application sets, administration and users.
Basic tile operation
A click (left or right) in a menu tile offers:
- Show page, data points, Trend Viewer
- Show page, data point, Trend Viewer in a new tab
Alarm query
Clicking an alarm icon displays a list of plants with pending Alarms↑.
Additional information
- "Use your own dashboard" shows plant operators, service technicians, etc. how to take advantage of ‘Dashboard > Overview'
- To learn how to setup your own dashboard, see "Dashboard editor for plants and systems".
- "Create dashboards specific to applications for individual roles" demonstrates how administrators can create and assign user-specific dashboards.