Rendering dynamic with mappings
Rendering texts and elements dynamic through mapping
Data access technologies
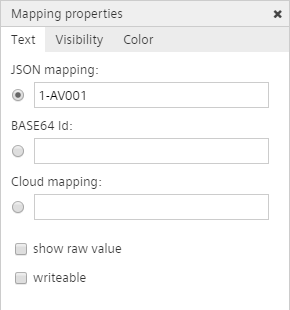
The graphic configurator (GC) has various data access technologies available in "Mapping properties". You can mix multiple data access technologies on one graphic. Access technologies include:
|
Mapping value or ID | Entry "Mapping properties" in GC | Notes |
JSON / Definable | JSON mapping: | The mapping file must be loaded to the controller accordingly |
Base64-ID of the item | BASE64 Id: | Direct access to the Automation Object (OAs). No loaded mapping file is required. As of VVS11. |
Cloud / Automatic or Definable | Cloud mapping: | The mapping file must be loaded to the controller accordingly |
General differences between JSON mapping, BASE64‑ID and cloud mapping:
- JSON mapping and BASE64‑ID are device API queries in which the values are queried directly from the POL controller via the device API. The response time can be different and depends on the controller↑ cycle time and the local Ethernet in which the POL controller is located. These queries are not subject to a COV and return the current last value.
- Cloud mapping queries are answered directly from the Climatix IC database. These queries are subject to the COV settings and independent updates from the controller to Climatix IC. The query returns the value of the last COV update.
Functions
Three functions are available in the "Mapping properties" menu to render an item dynamic:
- Text function
- Visibility function
- Color function
Text function

To use the format ‘String’, ‘Show raw value’ must be activated.
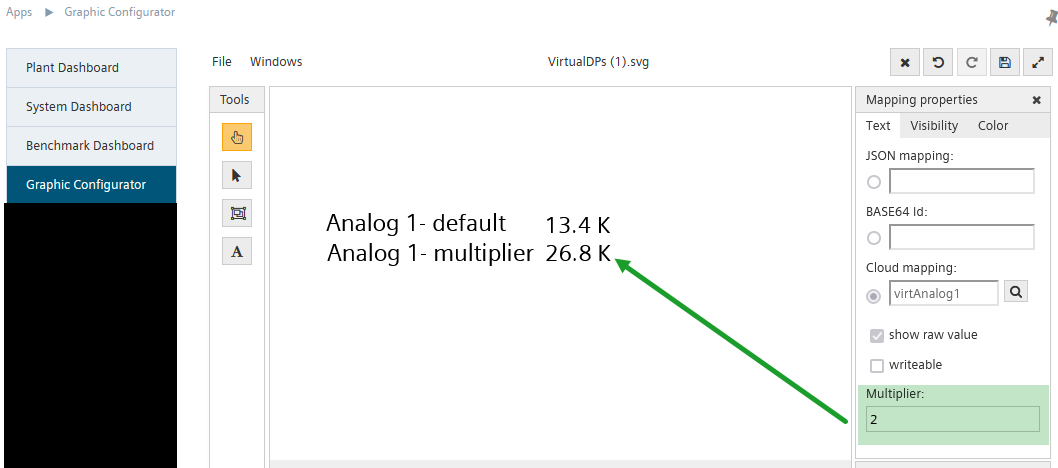
Multiplier
Similar to User Dashboards, values can be scaled in the graphic configurator (see section 'Scaling data point values'). Text elements have a multiplier available in the graphic editor. It can display the real data as transmitted by the plant by a factor x in the dashboard.
The function can be used, for example, to:
- Convert a negative value to a positive value.
- Increase the display size of a very small value.
- Decrease the display size of a very large value.
- Convert a value to another unit, for example, Wh to kWh.
- Go to a text element that displays a data value.
- Select 'Text'.
- Enter the multiplier for the text element in the 'Multiplier' field.
- The data value in the text element is multiplied by the multiplier and displays on the dashboard.
- The new data point is used for display on the dashboard and web graphic but has no effect on the original values.
Side note: Wildcard syntax
The wildcard syntax defines how the value is displayed.
The syntax is available in the SCOPE help "Project tree > Watch pages > Settings" under "Default Format" with a table of permissible special characters and examples.
Compressed example:
Format string | Raw value | Unit | Result |
|---|---|---|---|
|
"===0.0= %%%" | 23.2 | °C | " 23.2 °C" |
"===0.0= %%%" | 23,256 | bar | " 23.26 bar" |
"===0.0= +++" | 23.2 | °C | " 23.2 °C" |
"===0.0= +++" | 23,256 | bar | " 23.26 bar" |
"===0.0= +++" | -3.6 | °C | " -3.6 °C" |
"===0.00 +++" | -3.6 | °C | " -3.60 °C" |
"###0.0# %%%" | 23,256 | °C | "23.26 °C" |
"###0.0# %%%" | -3.6 | °C | "-3.6 °C" |
"###0.0= %%%" | -3.6 | °C | "-3.6 °C" |
"0000.0# %%%" | 23,256 | °C | "0023.26 °C" |
Text function, mapped controller value
- The SCOPE project opens with the corresponding application.
- The graphic configurator is open.
- Create a text wildcard with a defined syntax in the graphic configurator (see above).
- Highlight the text wildcard in the graphic configurator and select the "Text" tab in "Mapping properties".
- Open the properties in the SCOPE for the desired items and select the "Mapping" tab.
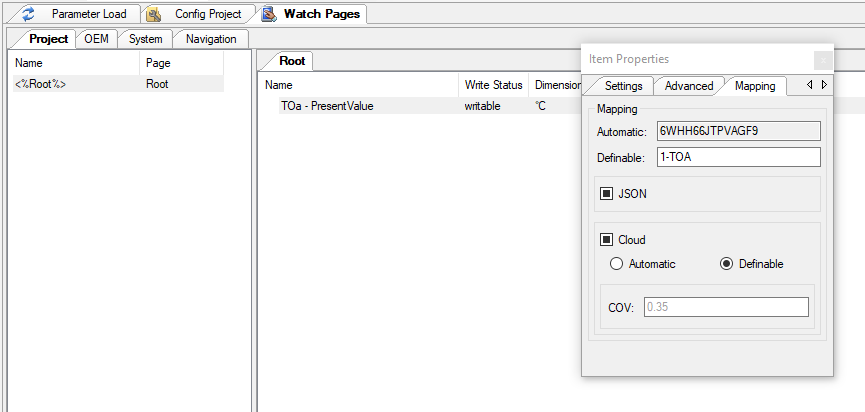
- Copy the definable value from SCOPE to the "JSON Mapping:" field of the graphic configurator.
- "JSON mapping:" must be selected.
Text function, unmapped controller value
Note: This method works as of VVS11. Mapping is not required. You must acquire the Base64 Id for the item.
- Steps 1 and 2 are the same.
- Highlight the item in SCOPE in the Watch Page pane.
- Right-click and select "Search in Browser".
- The specific item member is now selected in the browser for the data points.
- Right-click the item member and select "Copy > Copy Base64 Id".
- Add the copied Base64 Id to "BASE64 Id:" of the graphic configurator.
- " BASE64 Id:" must be selected.
Text function, access to cloud value
- Steps 1 to 3 from 'Text function, mapped controller value' are the same.
- Copy the automatic strings if the cloud is set to automatic; or copy the definable string from SCOPE if the cloud is set to definable and add it to the "Cloud mapping:" of the cloud graphic configurator.
- "Cloud mapping:" must be selected.
- The values are retrieved directly from the cloud where offline data is also included.
Visibility function
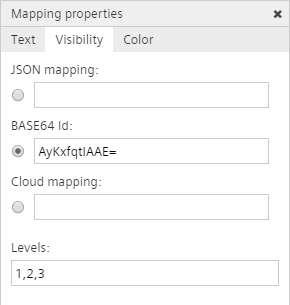
Is often used to show and hide a group of graphic elements based on the value of another data point. "Levels" indicates the data point value at which the graphic element is visible. Multiple values can be comma separated (no space).
Mapping the queried data point is similar to the methods documented above.
Color function
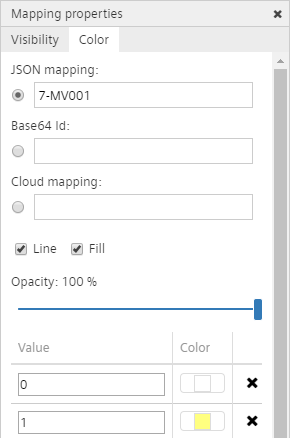
Permits color dynamics of graphic elements based on the value of another data point. A color is defined per value for the mapped data point; the graphic element is displayed in that color.
Mapping the queried data point is similar to the methods documented above.
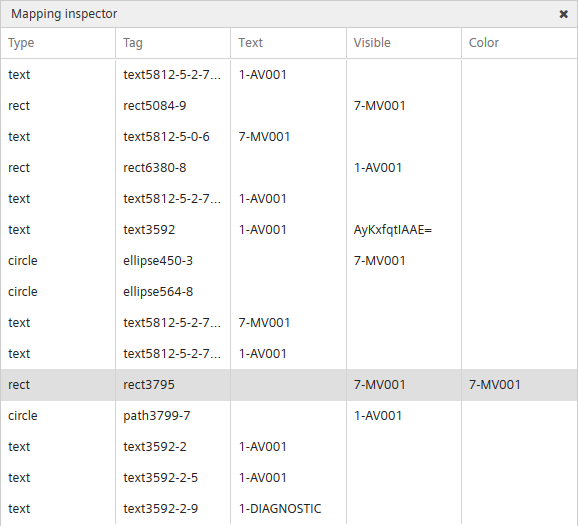
Check mapping and optimize visibility
Mapping inspector
The "Mapping inspector" provides a very good overview; it lists all mapped elements in tables and can go to the elements.
Element inspector
The "Element inspector" offers yet another access and optimization, organized by graphic groups. Once an element is mapped, the data point is included in parenthesis at the end of the element name, e.g. "(1-AV001).
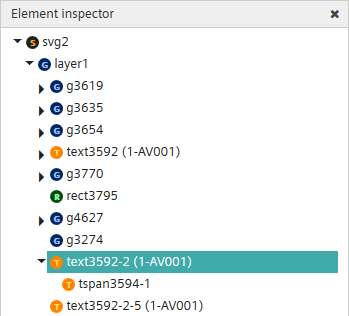
NOTICE
Hint
- In the element inspector, you can double-click elements and groups to rename them. And set up a meaningful and systematic structure.
- Elements can now be grouped by dragging the elements to a group. This significantly simplifies control of visibility.
Test mapping
Prior to adding the dynamic graphic to the application set, you should conduct a function test on whether the programmed access works. You can do this with just a few clicks directly in the browser.
- You have rendered dynamic a SVG graphic with data points in the graphic configurator and saved it in the browser.
- The referenced data points are loaded to the controller and be queried or are available in the cloud.
- You have privileges to the controller data points, i.e. controller data points are accessing in the menu "Operating".
- Go to "Operating > 'my plant' > Data points".
- You can verify one more time that you have general access to the data points.
- You find the plant ID in the browser as a string between "Operating/" and "/Data Points" (this is a string with the syntax uuu-vvv-www-xxx-yyy).
- Copy the plant Id.
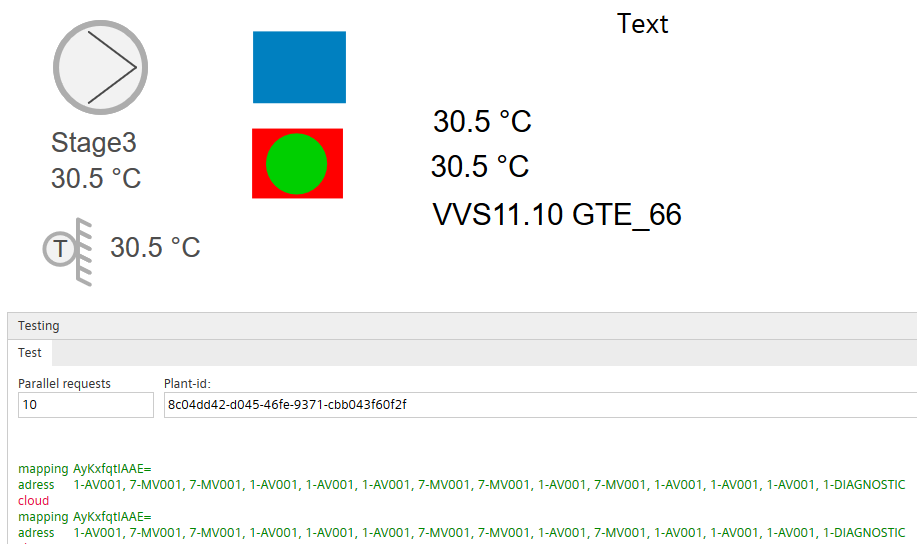
- Return to the graphic configurator and open "Windows > Test".
- Add the plant Id from the clipboard to the field "Plant Id".
- The number of parallel queries determines how many data points can be queried at the same time.
- Press "Start test".
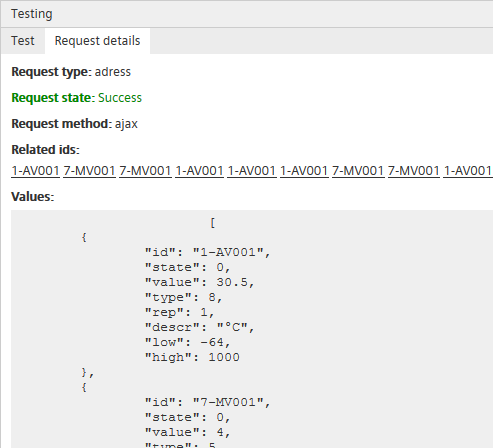
- The polling times are listed as rows.
- You can click a row during testing or a stopped test and research the data.
Export dynamic, edited graphic
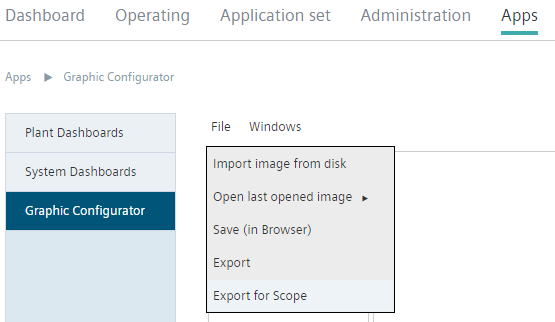
The last step is to export the dynamic and test graphics as SVG file or ZIP file. The export as ZIP file is provided for use in SCOPE.
Export as SVG file:
- Select File > Export.
- The graphic is exported as SVG file to your default storage folder.
Export as SVG file:
- Select "File > Export for Scope".
- The graphic is exported as ZIP file to your default storage folder (for example: C:\Downloads\scope.zip).
- Unzip the file to your project folder.
- Regenerate the HMI4WEB and load it to the controller↑.
- The SCOPE folder is C:\CLIMATIX\Projects\TEST\Input\Web