Bar tile
- Display multiple data points as a bar tile.
- Set the position of the bar tile in Tile properties:
- Data points for display
- Labeling and positioning of the axes and setting the units on the axes
- Labeling and positioning of the diagram key
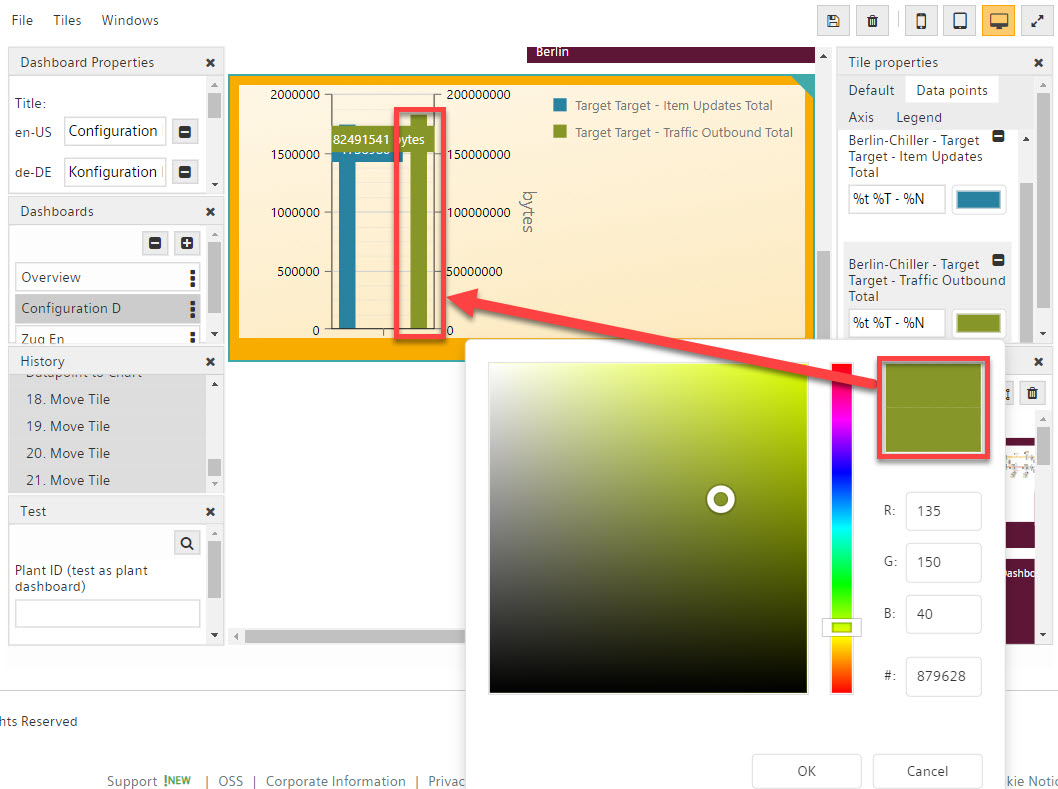
- Set the color of the displayed values of individual data points in the Tile properties under 'Data points':
- Click the color field next to the data point.
- This opens a select window for colors.
- Select the desired color for your data point.
- The bar graph for your data point changes to that color.
Hide Y axis in a bar chart tile
All Y axes can be hidden in the bar chart tile to save space. See section 'Hide Y axis in a chart tile'.