Line tiles
- Displays multiple line data points as a line tile with adjustable update intervals.
- Set the position of the line tile in Tile properties:
- Data points for display
- Labeling and positioning of the axes and setting the units on the axes
- Update interval and displayed timeframe
- Labeling and positioning of the diagram key
- Set the color of the displayed values of individual data points under 'Data points':
- The same as described in 'Bar tiles'.
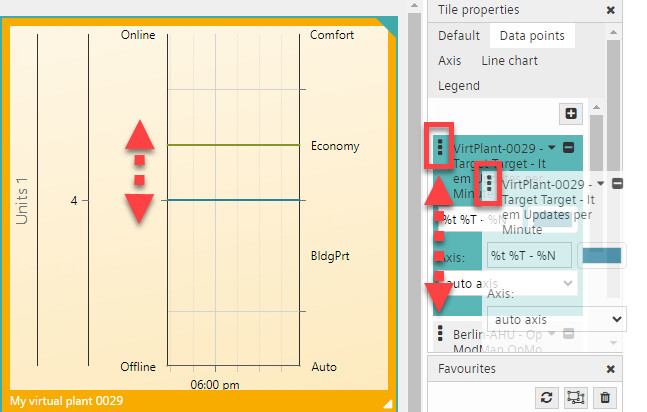
Changing the sequence of displayed data points after the fact
The sequence of the displayed data points in line tiles can be resorted after the fact.
- In the line tile diagram, go to Tile properties.
- In the 'Data points' tab, drag individual data points to the desired sequence.
- Select
 next to the data point designation and hold the left mouse button and drag up or down as needed.
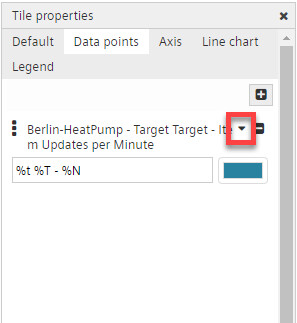
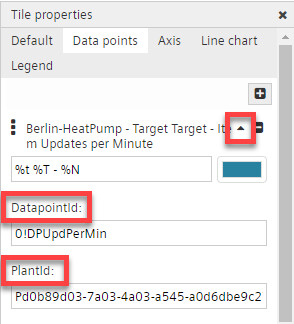
Display additional Information on data points
Additional information can be displayed and edited to improve the overview:
- 'DatapointId': The ID number of the data point.
- 'PlantId': The ID number of the plant to which the data point is assigned.
- In the line tile diagram, go to Tile properties.
- In the 'Data points' tab, click the ▼ icon.
- Additional information opens.
- In the 'Data points' tab, click the ▲ icon.
- Additional information closes.
Hide Y axis in a line chart tile
All Y axes can be hidden in the line chart time to save space. See section 'Hide Y axis in a chart tile'.
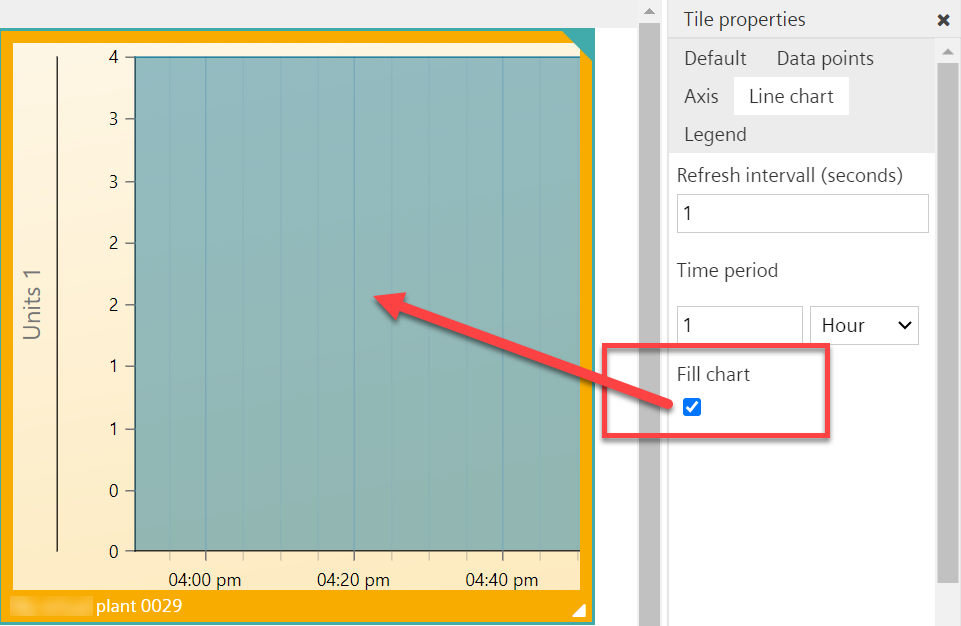
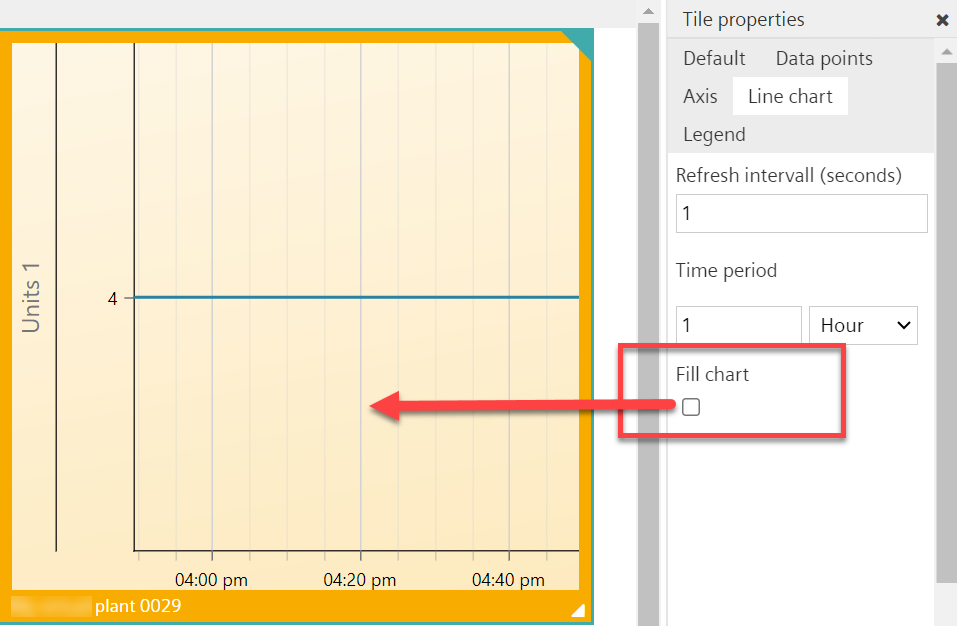
File out the trend lines in the line chart
The area below the diagram line can be highlighted in color within the line chart.
- In the line tile diagram, go to Tile properties.
- In the 'Line chart', select 'Fill chart'.
- The area below the trend line can be highlighted in color.
Trend line without color:
Trend line with color: