Detailed display of updates to Cloud elements in the 'Data point trend viewer'
Only the current sum of all entries displays if values on data points change due to new entries from Cloud elements. The data point menu 'Show chart' has a detailed view with a timeline trend display of the individual data point entries.
The detailed view permits a precise analysis of the data value over the selected periods. This allows highly precise device control, for example, to set COV thresholds ('COV files').
Open chart
Proceed as follows to display history data point trend data:
- Go to "Operating > Plants > 'My plant' > Data points > 'My data point'".
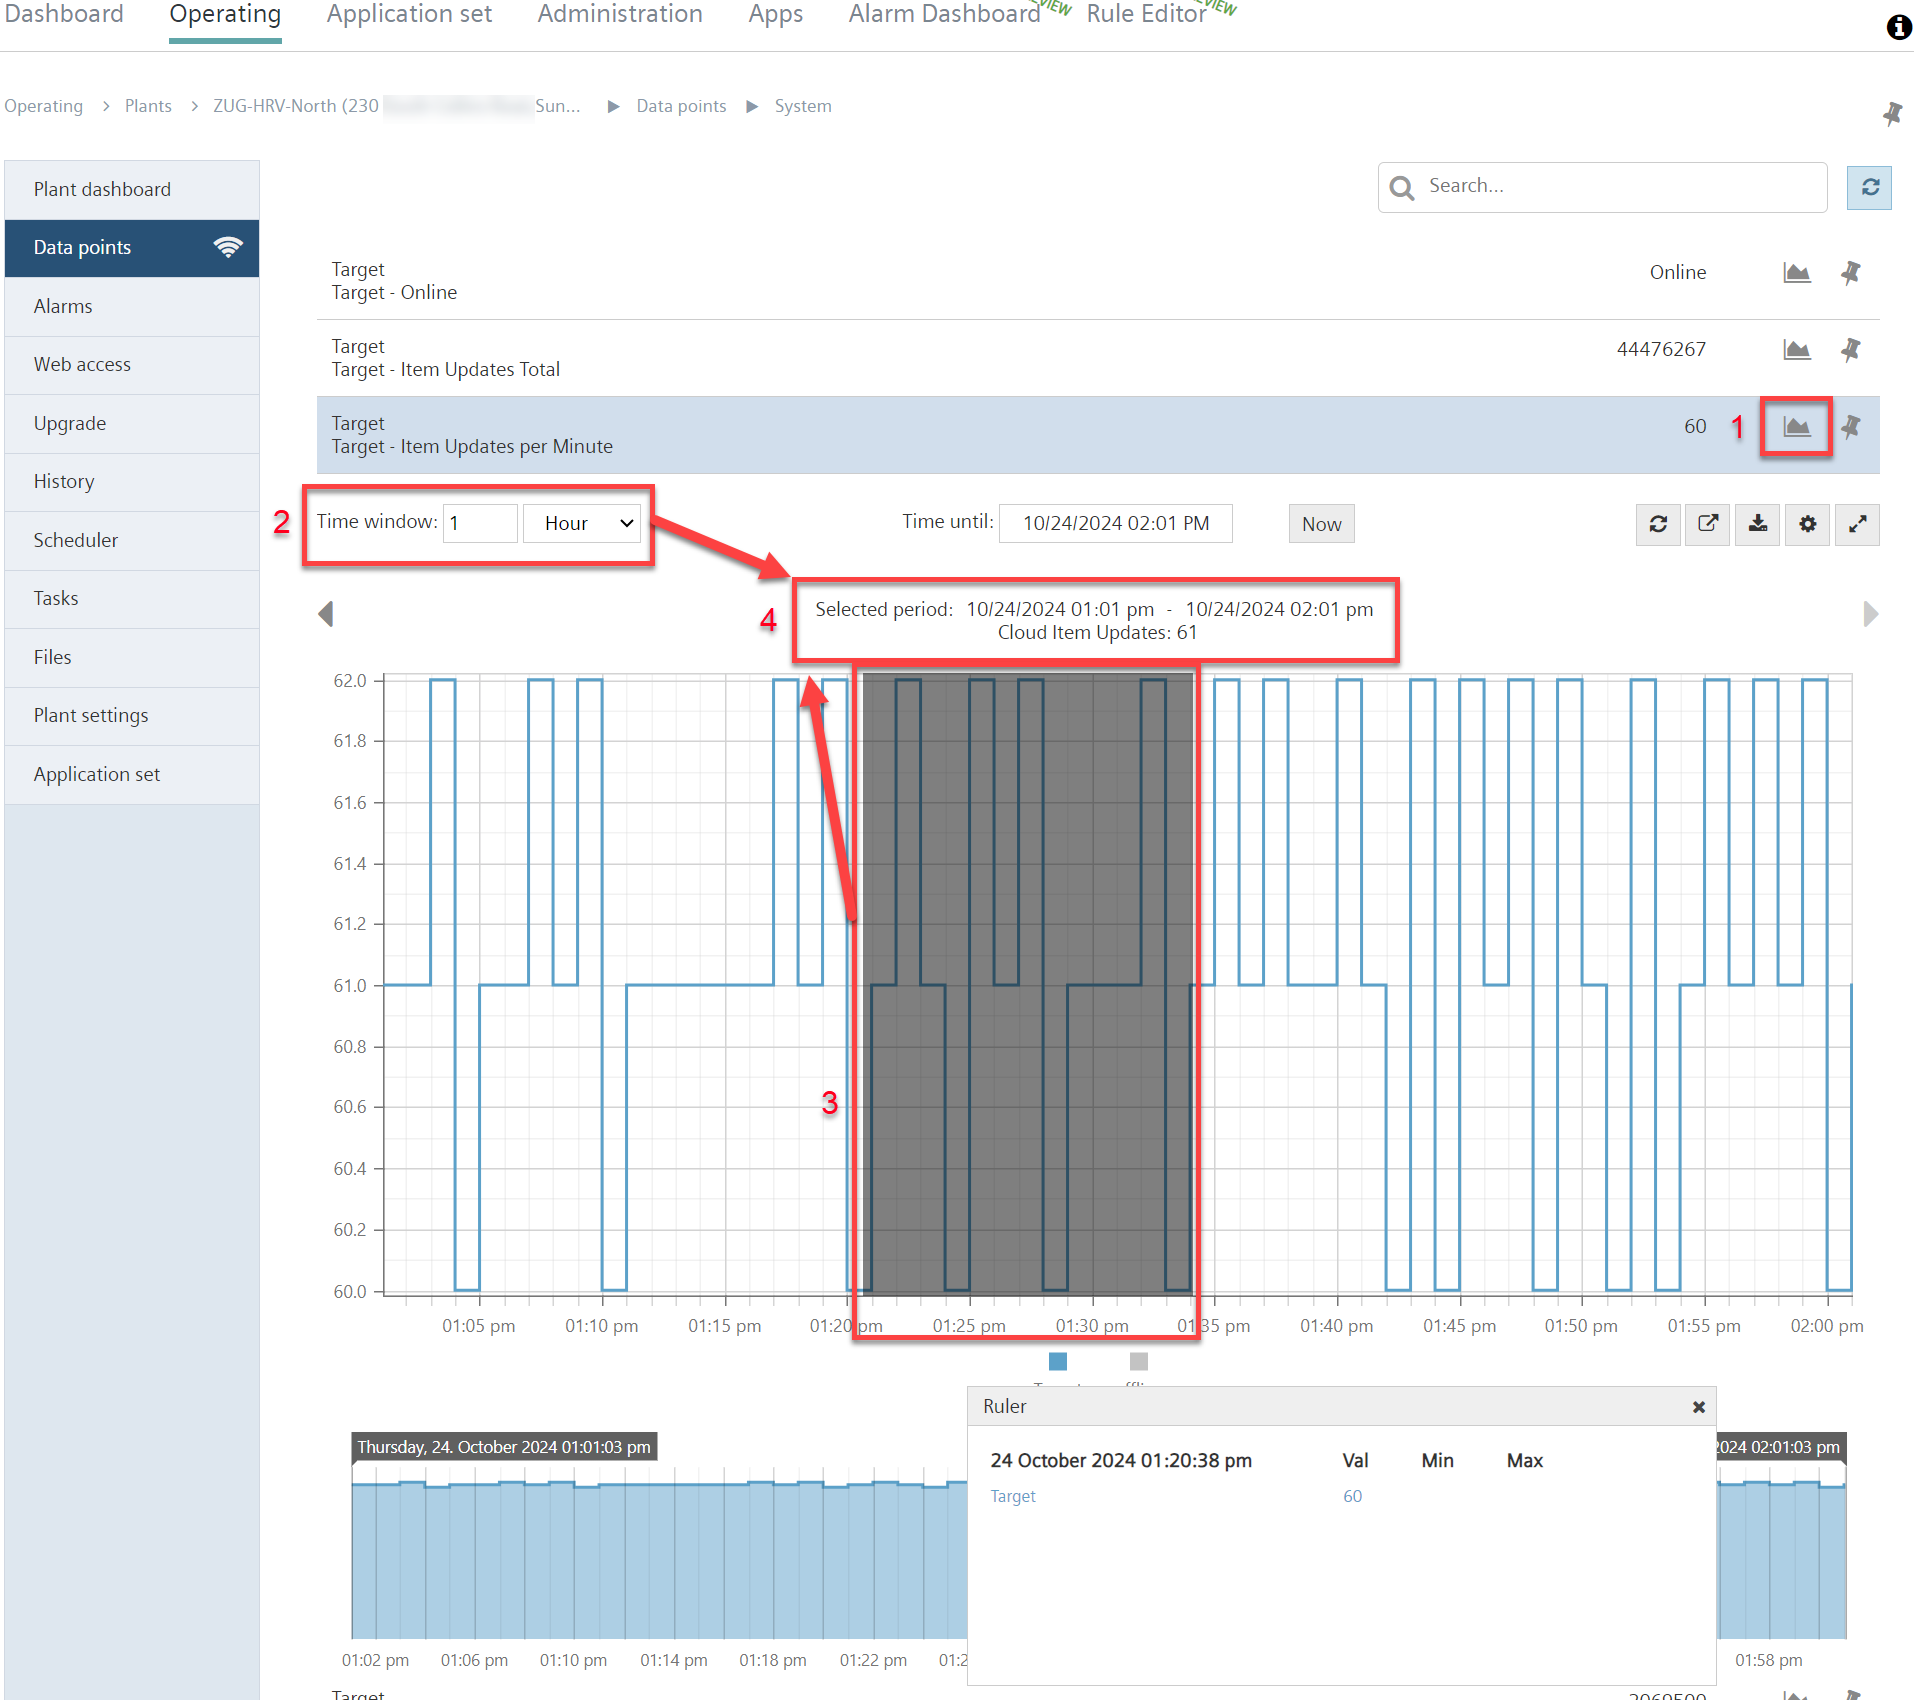
- Click the trend icon 'Show chart'
 (1) on the desired data point.
- A detailed view of the data point's cloud elements opens in the chart 'Data point Trend Viewer'.
- The history trend data can be analyzed.
- A diagram has no data that can be displayed in a chart if the 'Show chart’ icon is unavailable.
The functionality of the data point Trend Viewer is the same as the dashboard Trend Viewer, see "Work with the dashboard Trend Viewer".
Features
- Select the time horizon (2).
- Consider a zoomed view of the event period by highlighting the desired period on the chart (3).
- Each entry represents an update to the cloud element.
- Summary of cloud element update during the select period (4).
- The data point Trend Viewer is visible to all users regardless of user rights.
Use of data point or dashboard Trend Viewer
Not all data points for your plant are mapped to the dashboard diagrams. Data points not mapped there can be analyzed in the data point Trend Viewer.