Alarms on a time axis
The "Alarms on a time axis" view displays a bar chart for the number of incoming alarms↑ per select plants and selected period:
- Go to menu "Alarm Dashboard > KPIs > Alarms on a time axis".
- Select one or more desired plants using the filter (1).
- A new window 'Advanced filter search' opens.
- Filter desired plants (see 'Advanced filter search by plants with an alarm').
- The number of displayed filterable plants depends on the selected period (2). Only plants that have an alarm within the selected period can be filtered to display by 'Plant name'.
- Click 'Apply' to apply the filter.
- Indicate the period to display plant alarms.
- The larger the period, the higher the probability of finding plants with alarms.
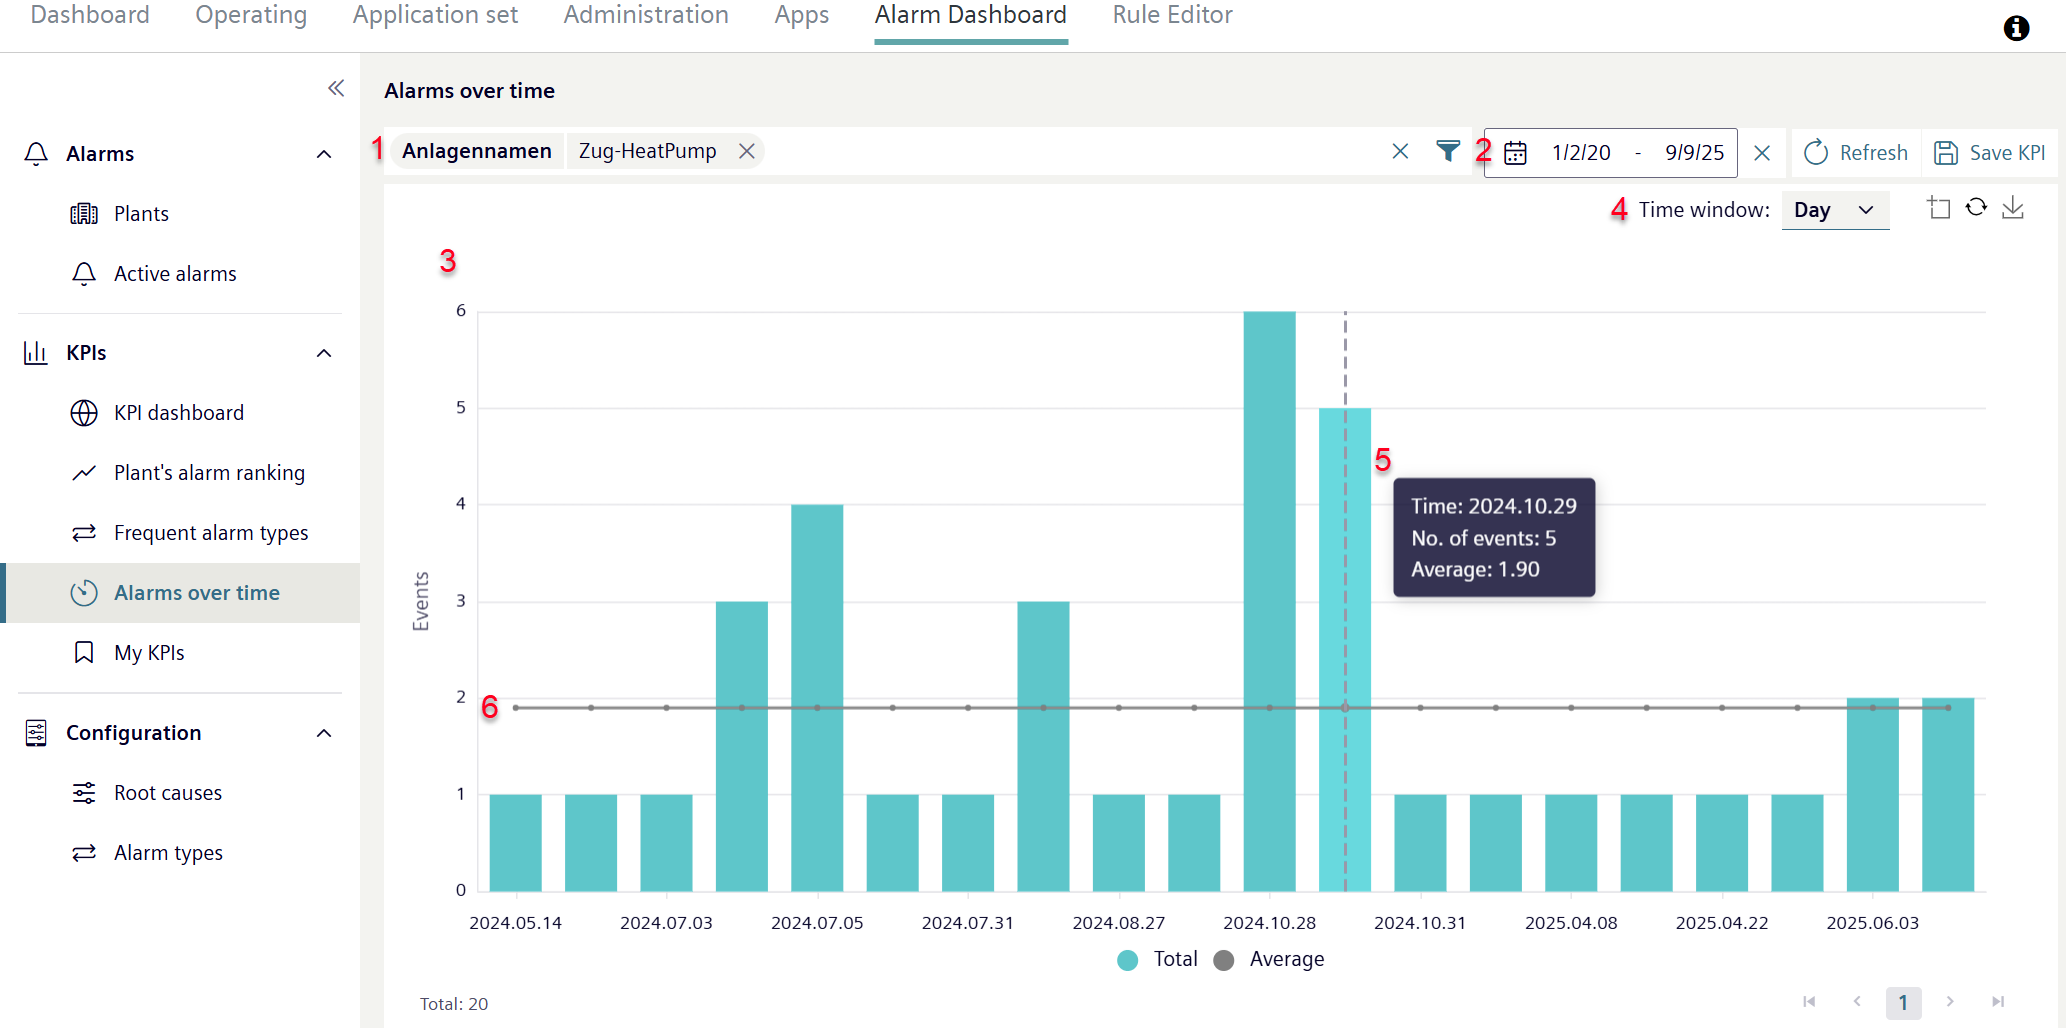
- Displays filtered alarm types in a chart (3).
- Each bar in the chart represents the number of alarms within a time window.
- The size of the bar represents the frequency of alarms triggered during the selected period.
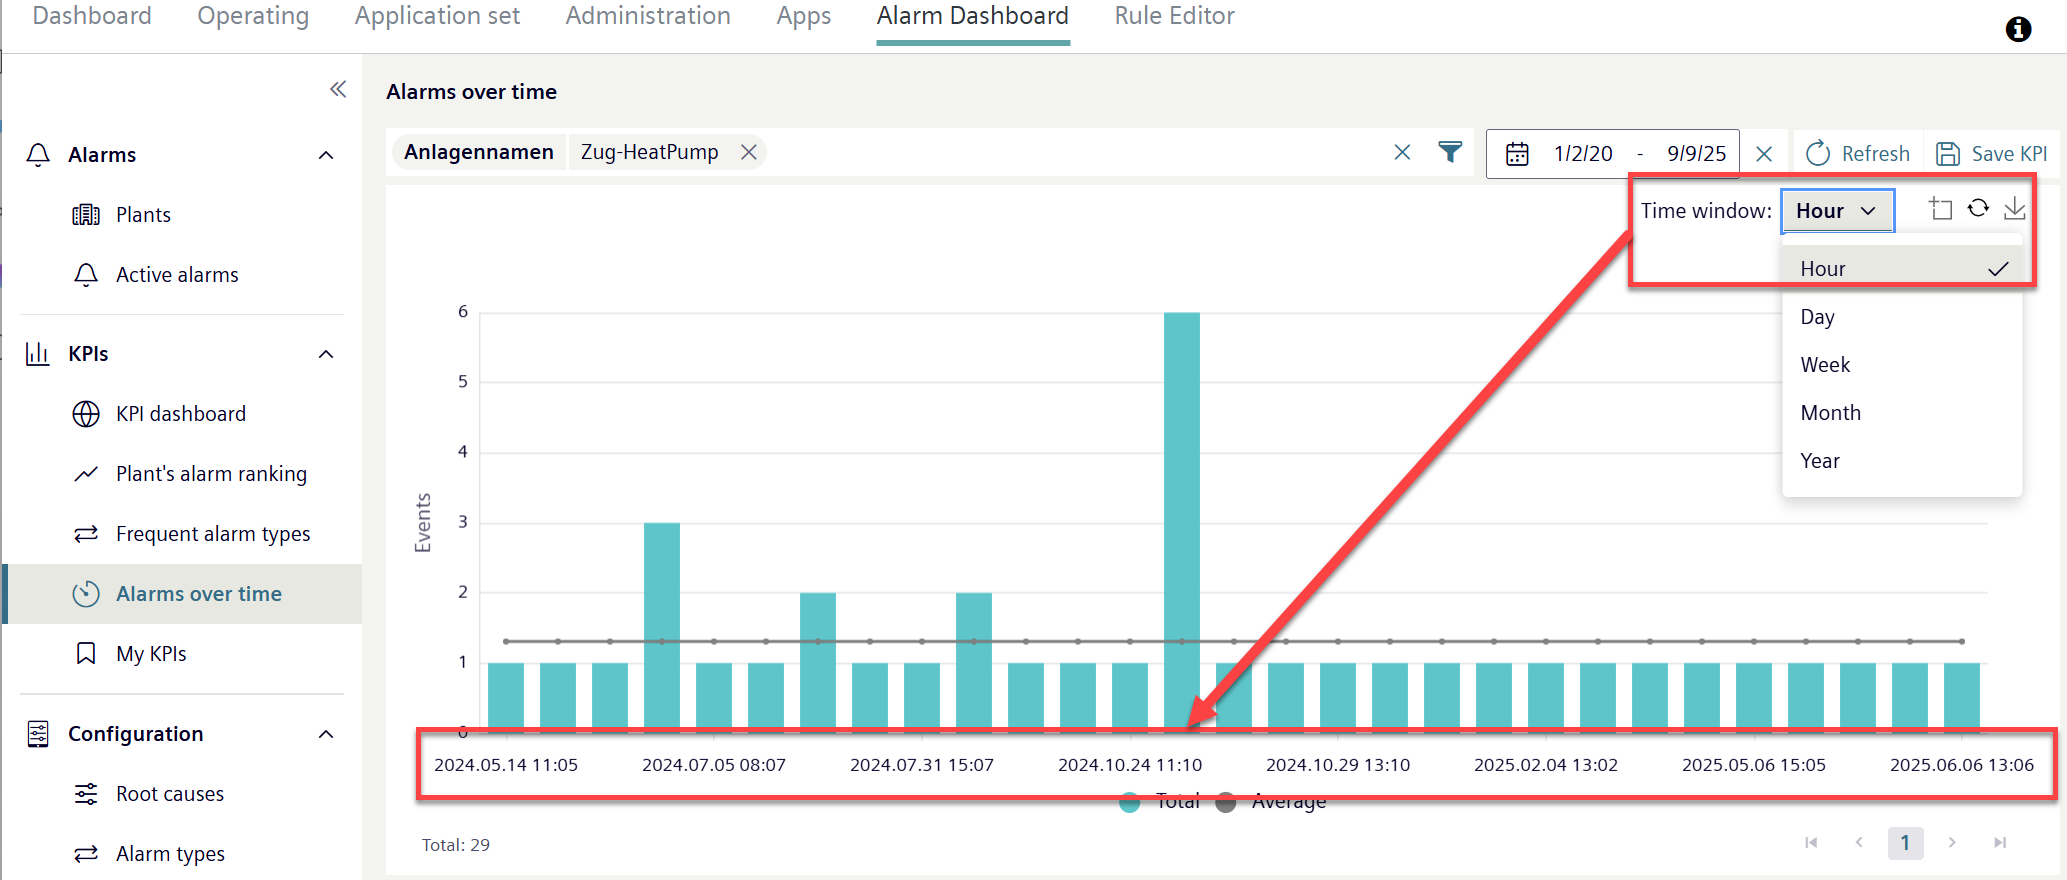
- Select the period (4) via the drop-down menu to depict alarms.
- The alarms in the chart are grouped by selected period:
- Move the mouse pointer over individual chart bars to display details (5).
- A ruler displays over the selected bar.
- A pop-up displays with information on Events↑ within the selected period.
- An average value of the number of alarms for the selected plants within the selected period is displayed as a line (6).