Chart
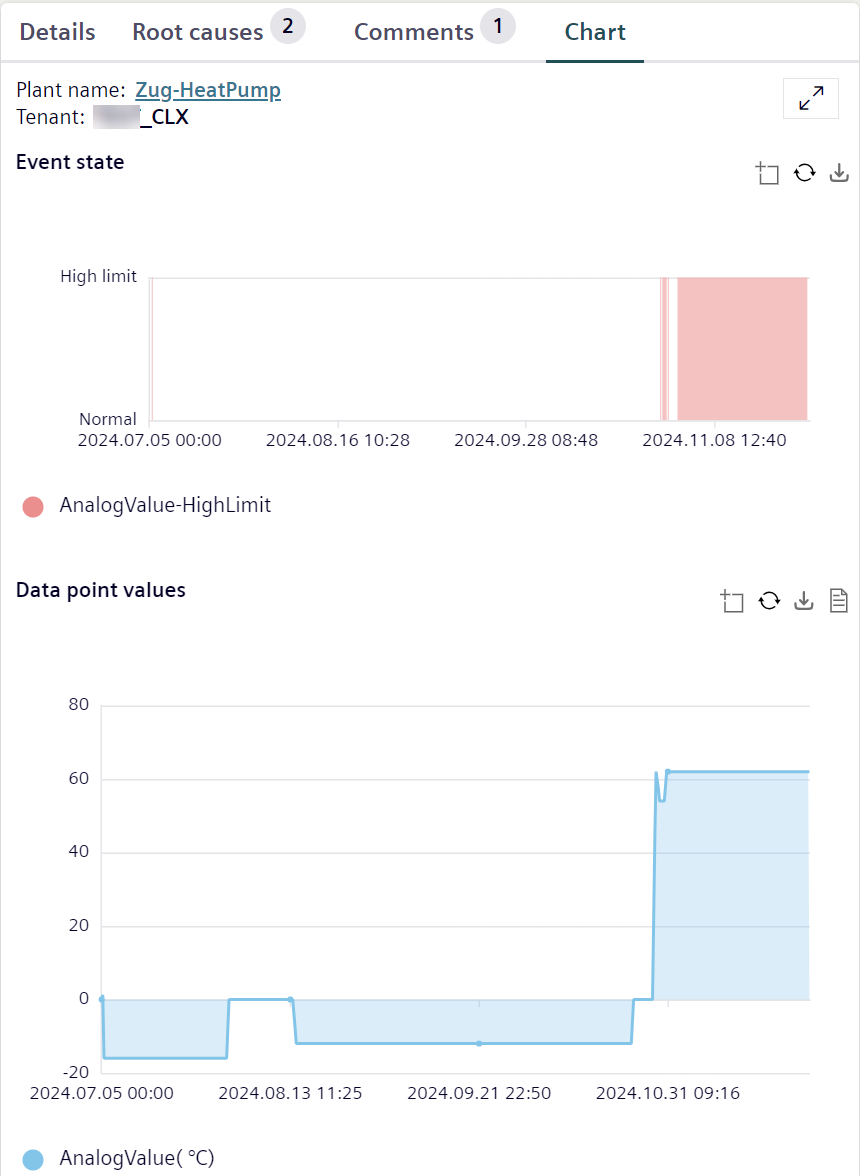
The tab 'Root causes' displays one or more diagrams on a plant alarm. Provide an overview of plant performance over a time axis. Performance data that deviates from the specifications can be quickly recognized in a chart and limited in time.
- The view functions can be zoomed in on diagrams for legibility.
- Export functions can be externally store data from the diagrams to file formats.
- See the list with function icons below.
Access to the function:
- Select the "Chart" tab.
- The alarm curve displays in diagrams.
- Click 'Plant name'.
- The specified plant opens in a new browser in the menu 'Plant Dashboard'.
Add or remove charts for an alarm type:
- Go to menu 'Create alarm type'.
- Select the alarm type to be modified there.
- Select or remote the data point in the 'Data points' field.
- The additionally selected data points are displayed as charts in tab 'Root causes'.
- The removed data points are no longer displayed as charts in tab 'Root causes'.
Icon | Function |
|---|---|
| Full screen mode: Expands the diagram. |
| Zoom: Increases the size of the diagram. |
| Reset zoom: Returns the value to the original size on the map. |
| Refresh: Refreshes the display. |
| Export to PNG: Exports the diagram as a PNG file. |
| Export to CSV: Exports a CSV file with the latest data. |


