Application set overview
The 'Application set overview' provides graphic information on data consumption in the application set. Additionally, thresholds can be defined to indicate whether the data consumption of an application set is within a desired range or exceeds it.
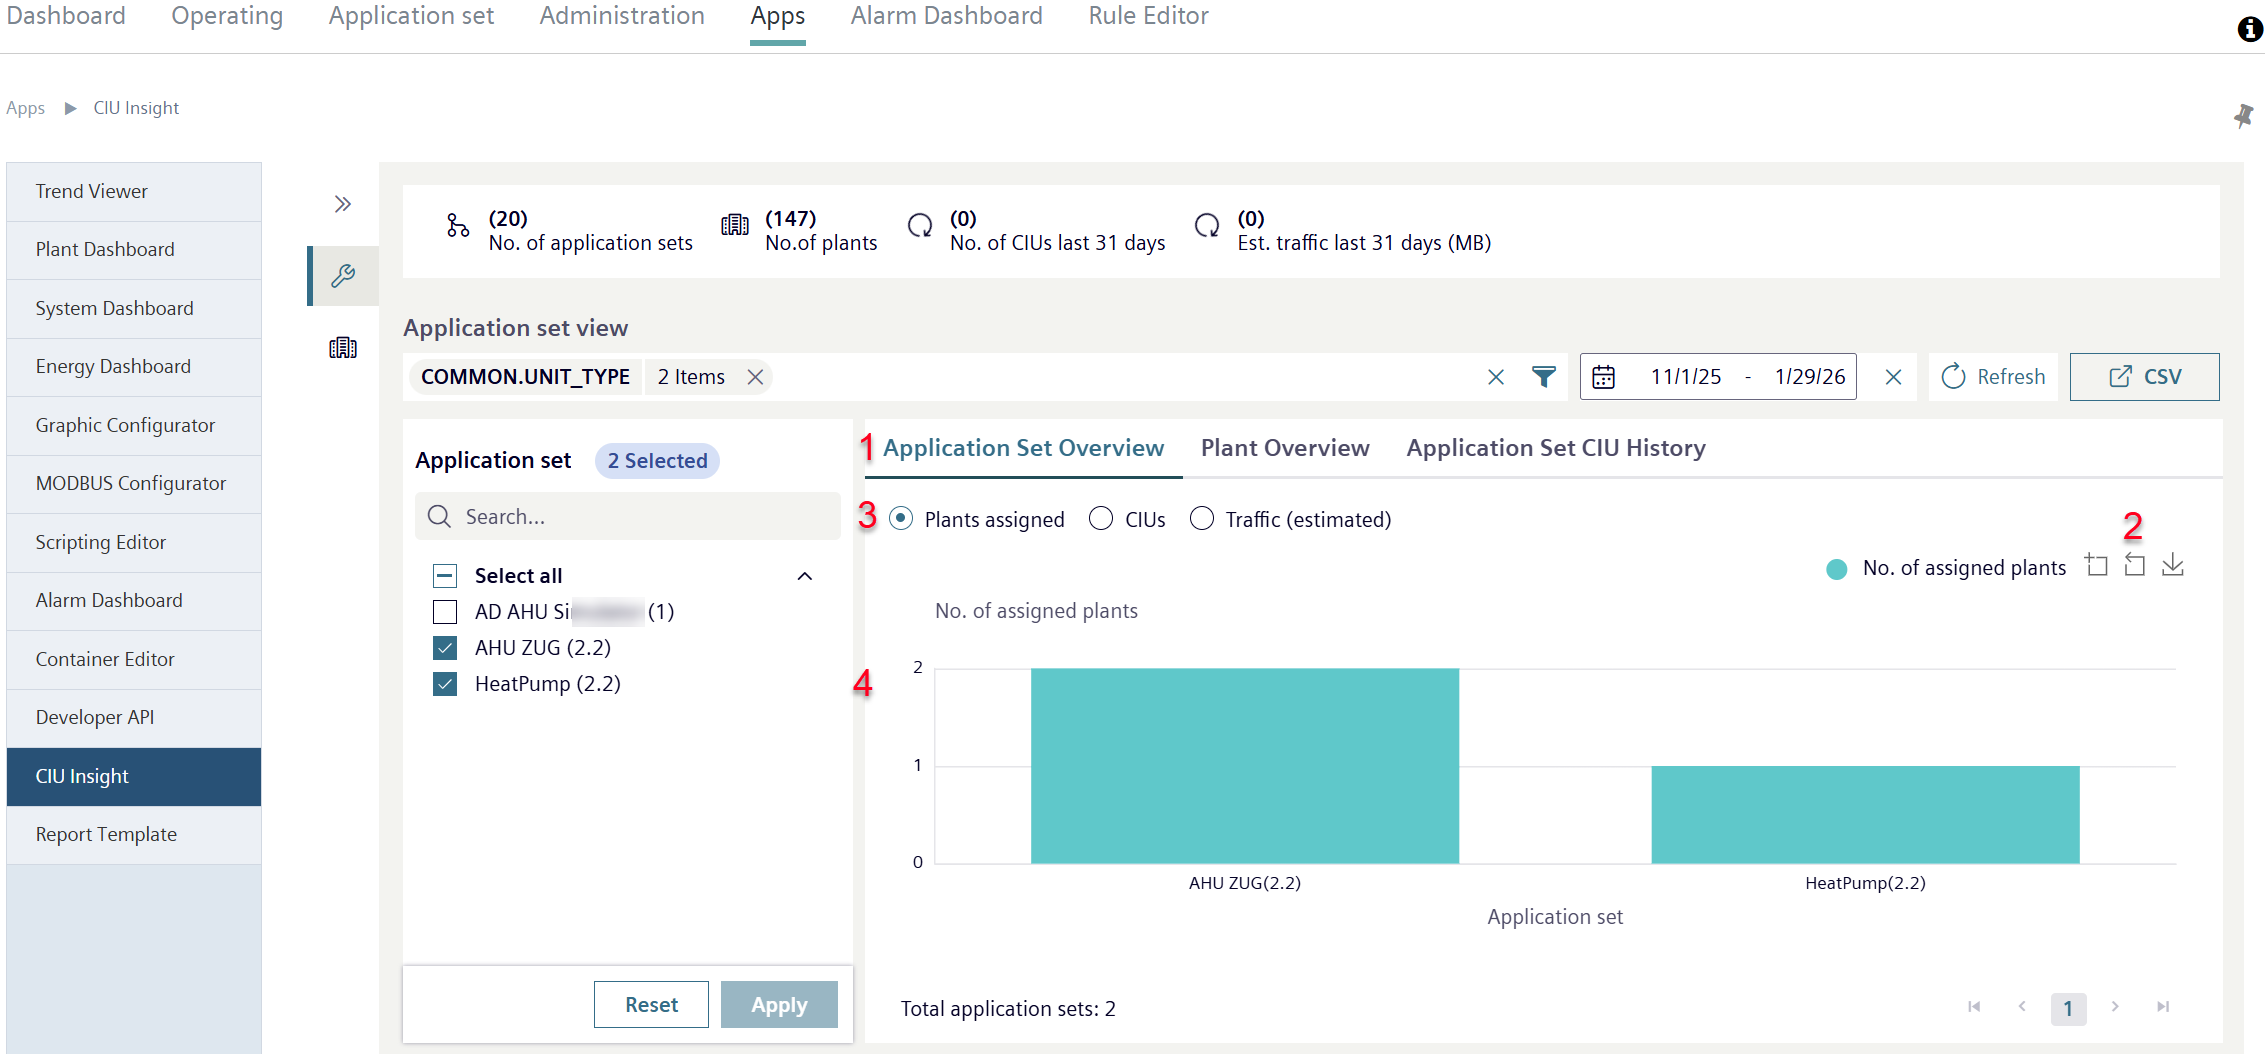
- In the Overview field, select the 'Application set overview' (1).
- An overview opens with three selectable views.
- Each of the three views is zoomable or can be saved as a .png file (2) (for operation: See 'Chart').
Assigned plants
- Click 'Assigned plants' (3).
- A column chart opens (4).
- The column chart shows the number of plants assigned within the selected application sets by plant type label.
CIUs
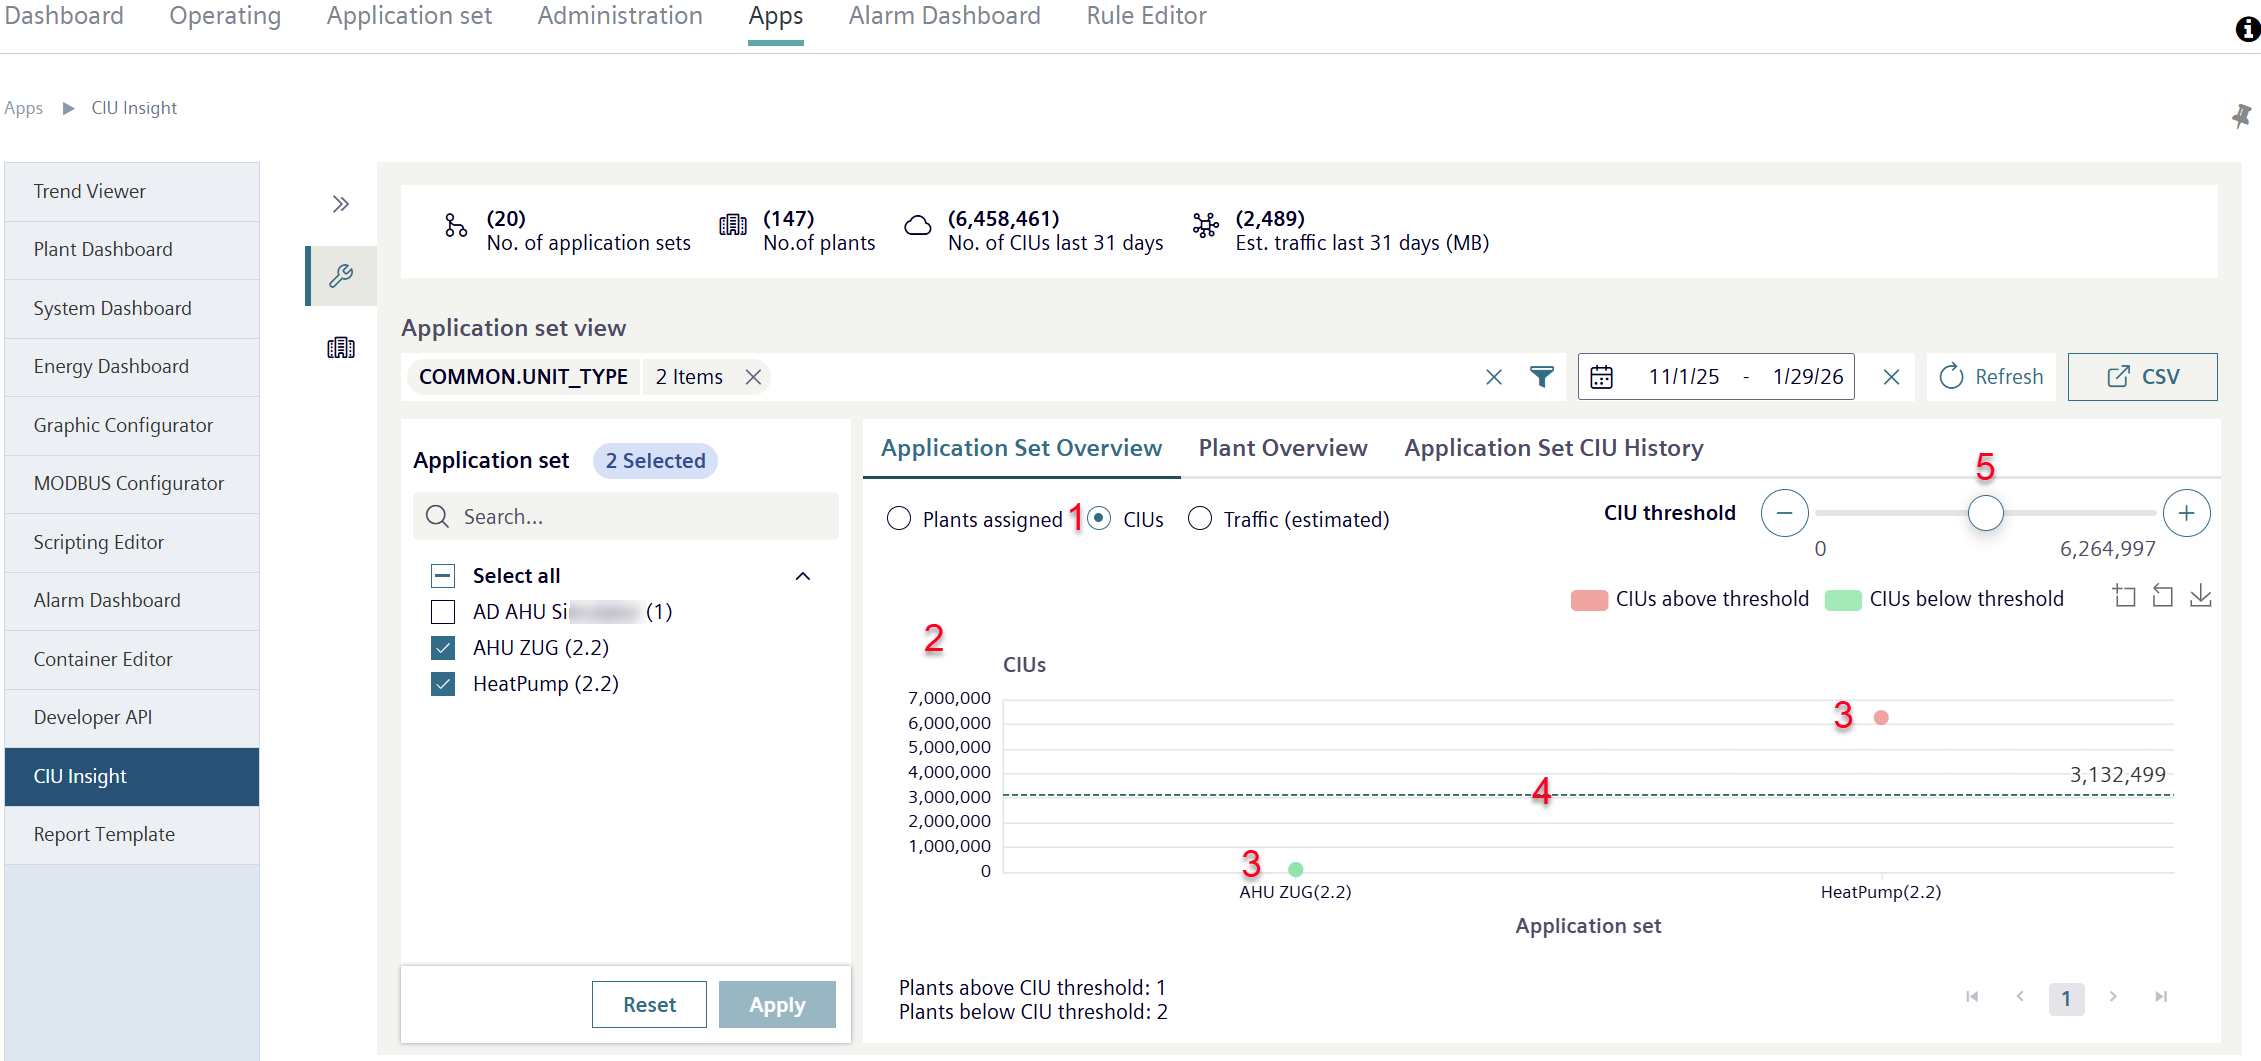
- Select 'CIUs' (1).
- A chart view opens with the number of Cloud item↑ updates (CIUs↑) per plant type in the selected application set (2).
- The number of Cloud item updates per plant type is displayed as a marker point in a scale diagram (3).
- A horizontal threshold value line for a a specific number of Cloud item updates is displayed within the scale diagram (4).
- Marking points that are below the defined threshold are green.
They indicate plant types that move within the desired max. number of Cloud item updates per plant type. - Marking points that are above the defined threshold are red.
They indicate plant types that are outside the desired maximum number of Cloud item updates per plant type. - Move the controller for the CIU to the desired threshold value (5).
- Set a new CIU threshold value.
- The horizontal threshold value line changes its position.
- The marking points located above or below the new threshold value change color.
- The chart view 'CIUs' indicates which plant types are located within the desired max. number of Cloud item updates and which have too high a number.
- Users can readjust the conspicuous plant types to reduce the number of Cloud item updates to the desired level.
Traffic↑ (estimated)
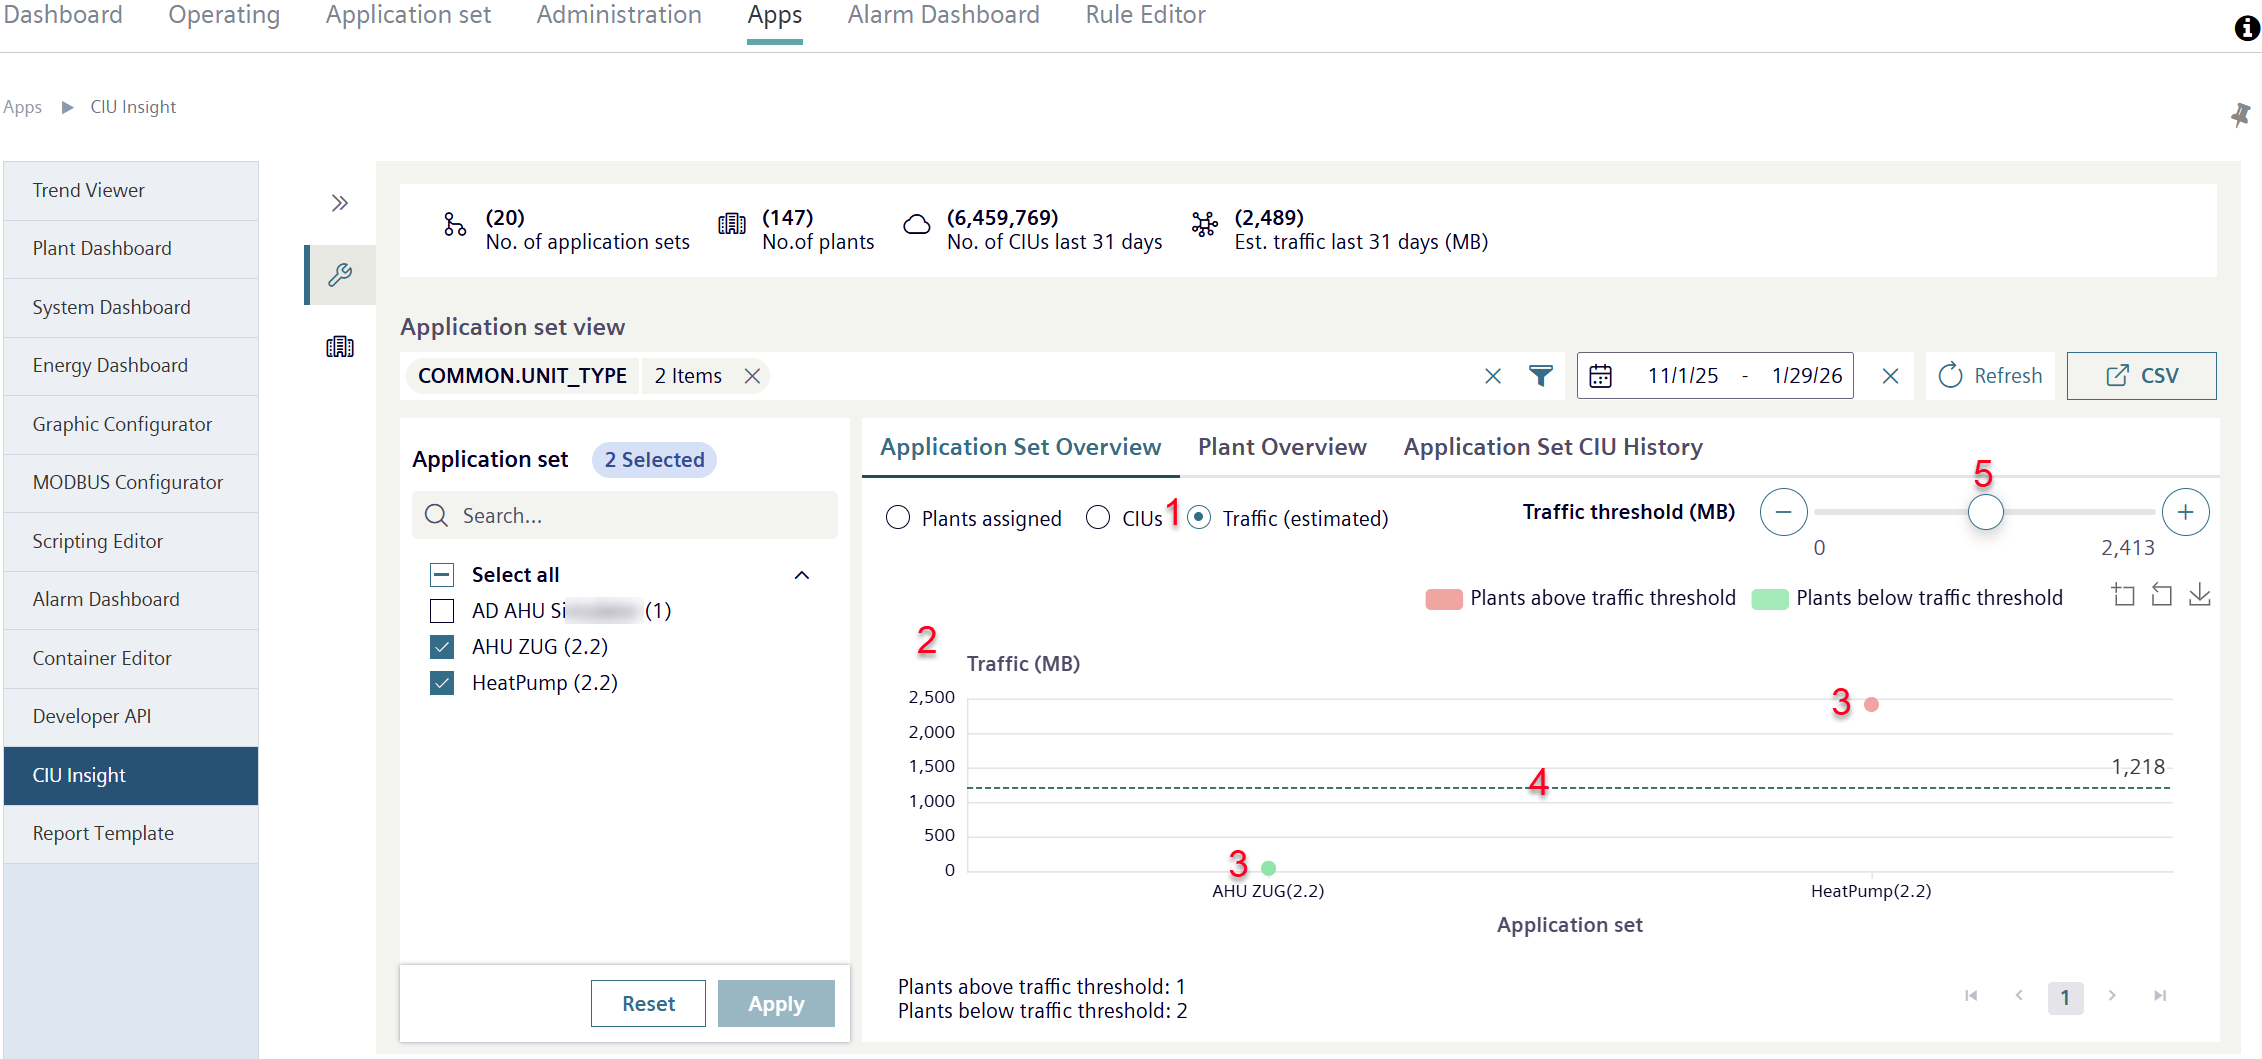
- Click 'Traffic (estimated)' (1).
- A chart view opens in with the data volume in megabyte (MB) for Cloud item↑ updates (CIUs↑) per plant type in the selected application sets (2).
- The data volume of Cloud item updates per plant type is indicated as a marking point in a scale chart (3).
- Within the scale chart, a horizontal traffic threshold line displays for a specific data volume of Cloud item updates (4).
- Marking points that are below the defined threshold are green.
They indicate plant types that move within the desired max. data volumes of Cloud item updates per plant type. - Marking points that are above the defined threshold are red.
They designate plant types that move outside the desired maximum data volume of Cloud item updates per plant type. - Move the controller for the traffic threshold value to the desired threshold value (5).
- A new traffic threshold value is set.
- The horizontal traffic threshold value line changes its position.
- The marking points located above or below the new traffic threshold value change color.
- The chart view 'CIUs' indicates which plant types are located within the desired max. number of Cloud item updates and which have too high a number.
- Users can readjust the conspicuous plant types to reduce the number of Cloud item updates to the desired level.