History
'History' provides graphic information on the data consumption from Cloud item updates↑ on the plant↑ level of a defined period. Users can see at a glance whether there was unusual data Cloud item↑ traffic was generated during a defined period.
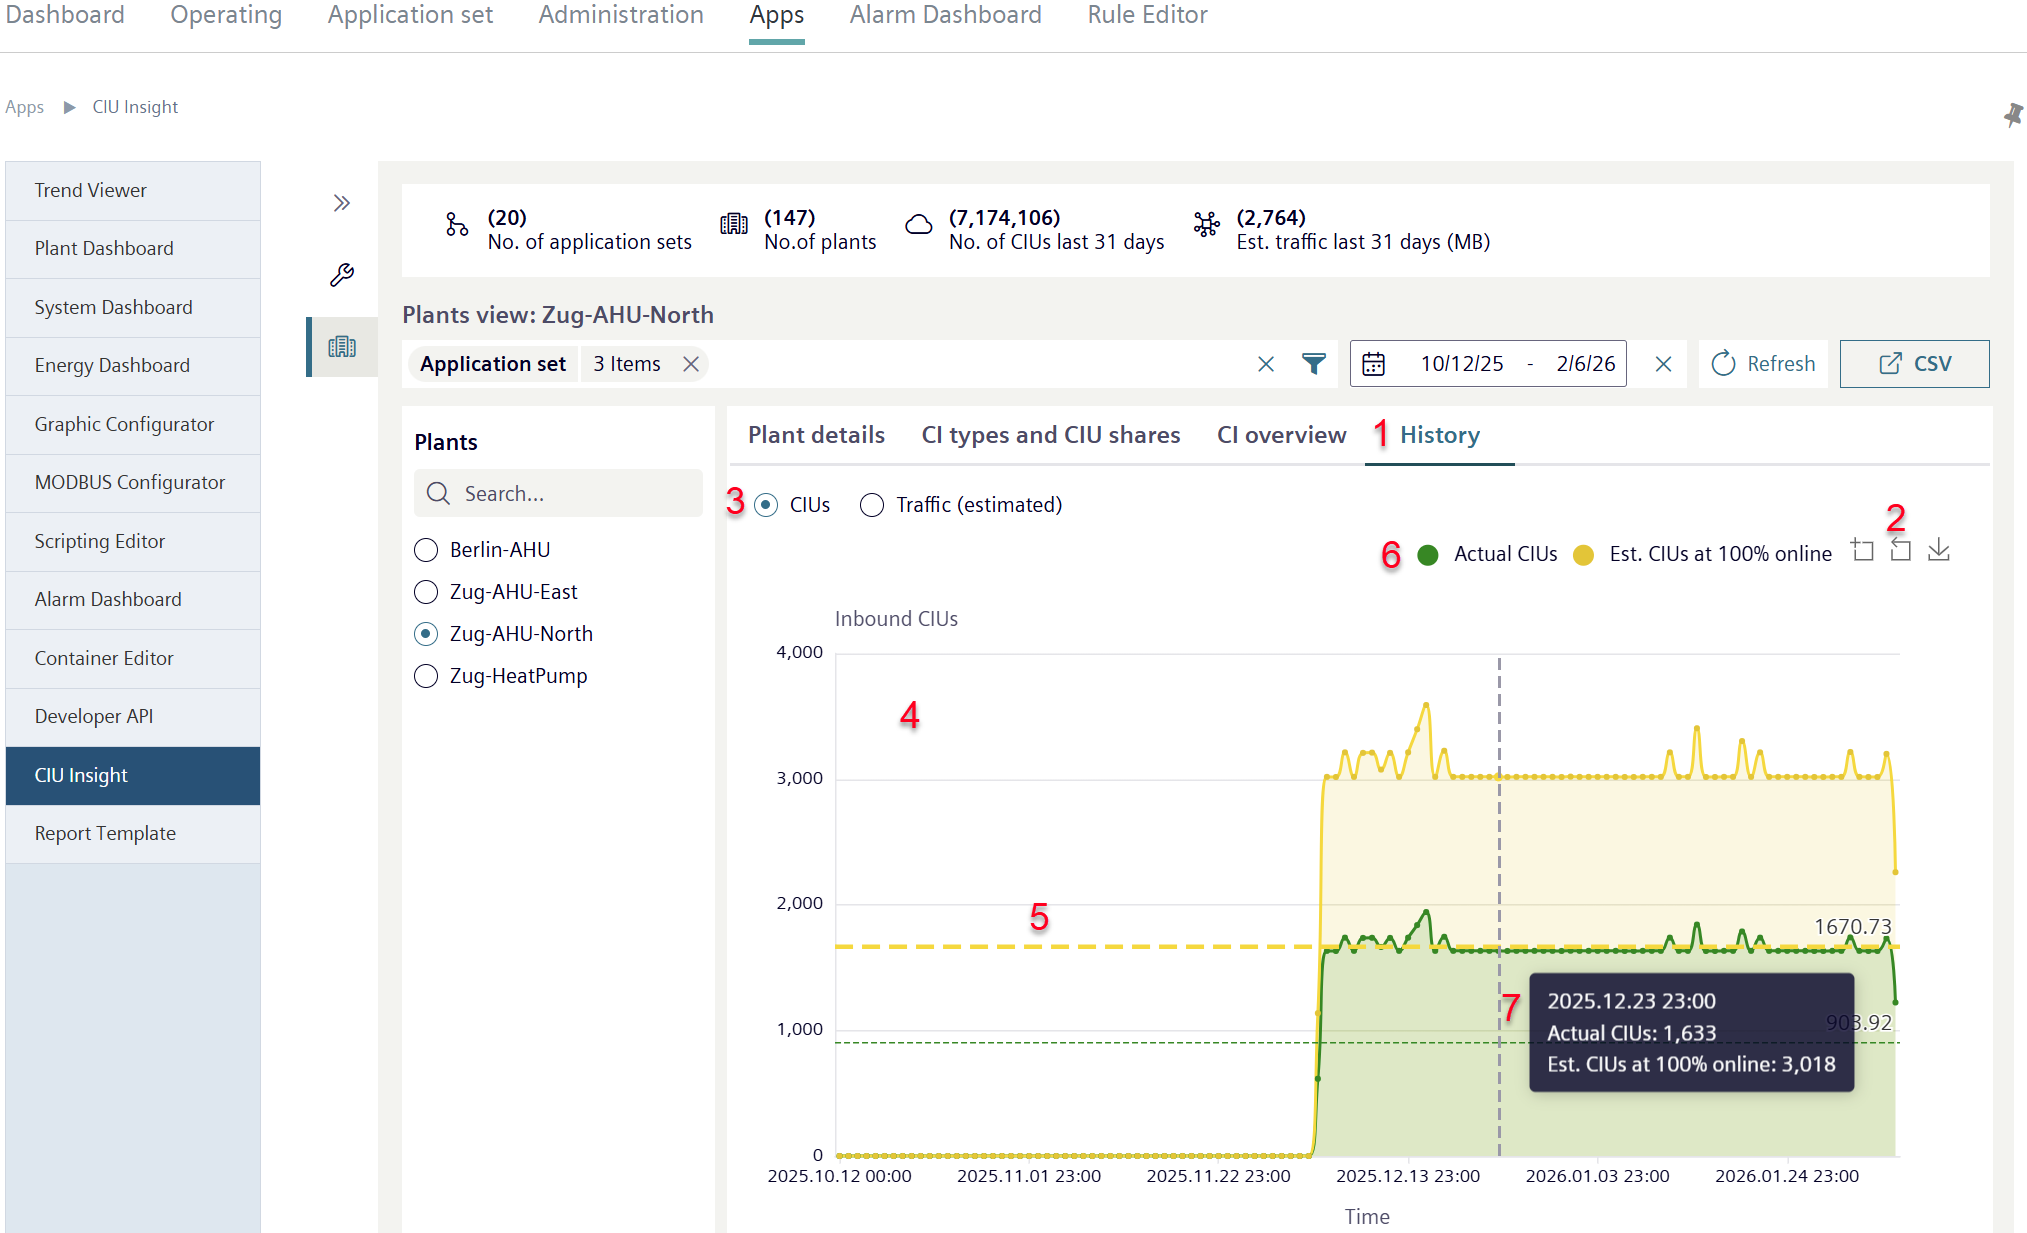
- In the overview, click 'History’ (1).
- An overview opens with two selectable views.
- You can zoom in and out in both views or save the view as a .png file (2) (on operation: See 'Chart').
CIUs
The 'CIUs' view displays the total number of Cloud item updates of the selected plants during the specified period, broken down by total number of plant Cloud items↑ and by the current number of plant Cloud item
- Select 'CIUs' (3).
- A line chart opens (4).
- The line chart shows the number of incoming Cloud item updates within the selected plant, broken down by total number and the number and number of current Cloud item updates.
- The dotted line display averages of the data sets (5).
- Click a legend entry (6).
- The data record the legend refers to is hidden from the chart.
- Click the legend entry again to display the corresponding data record.
- Move the cursor over a line chart.
- The data value of the segment at the Event time↑ on a timeline is displayed (7).
Traffic↑ (estimated)
The 'Traffic (estimated)' view displays the total traffic of the selected plant over the period specified by the user, broken down by:
- The amount of data in megabytes (MB) that a plant has actually consumed over the selected period.
- The amount of data in MB a plant would have consumed if continuously online.
A plant can, but does not have to be online all the time. If the plant is not online (for example, due to a connection interruption or during a maintenance period), then no traffic is generated.
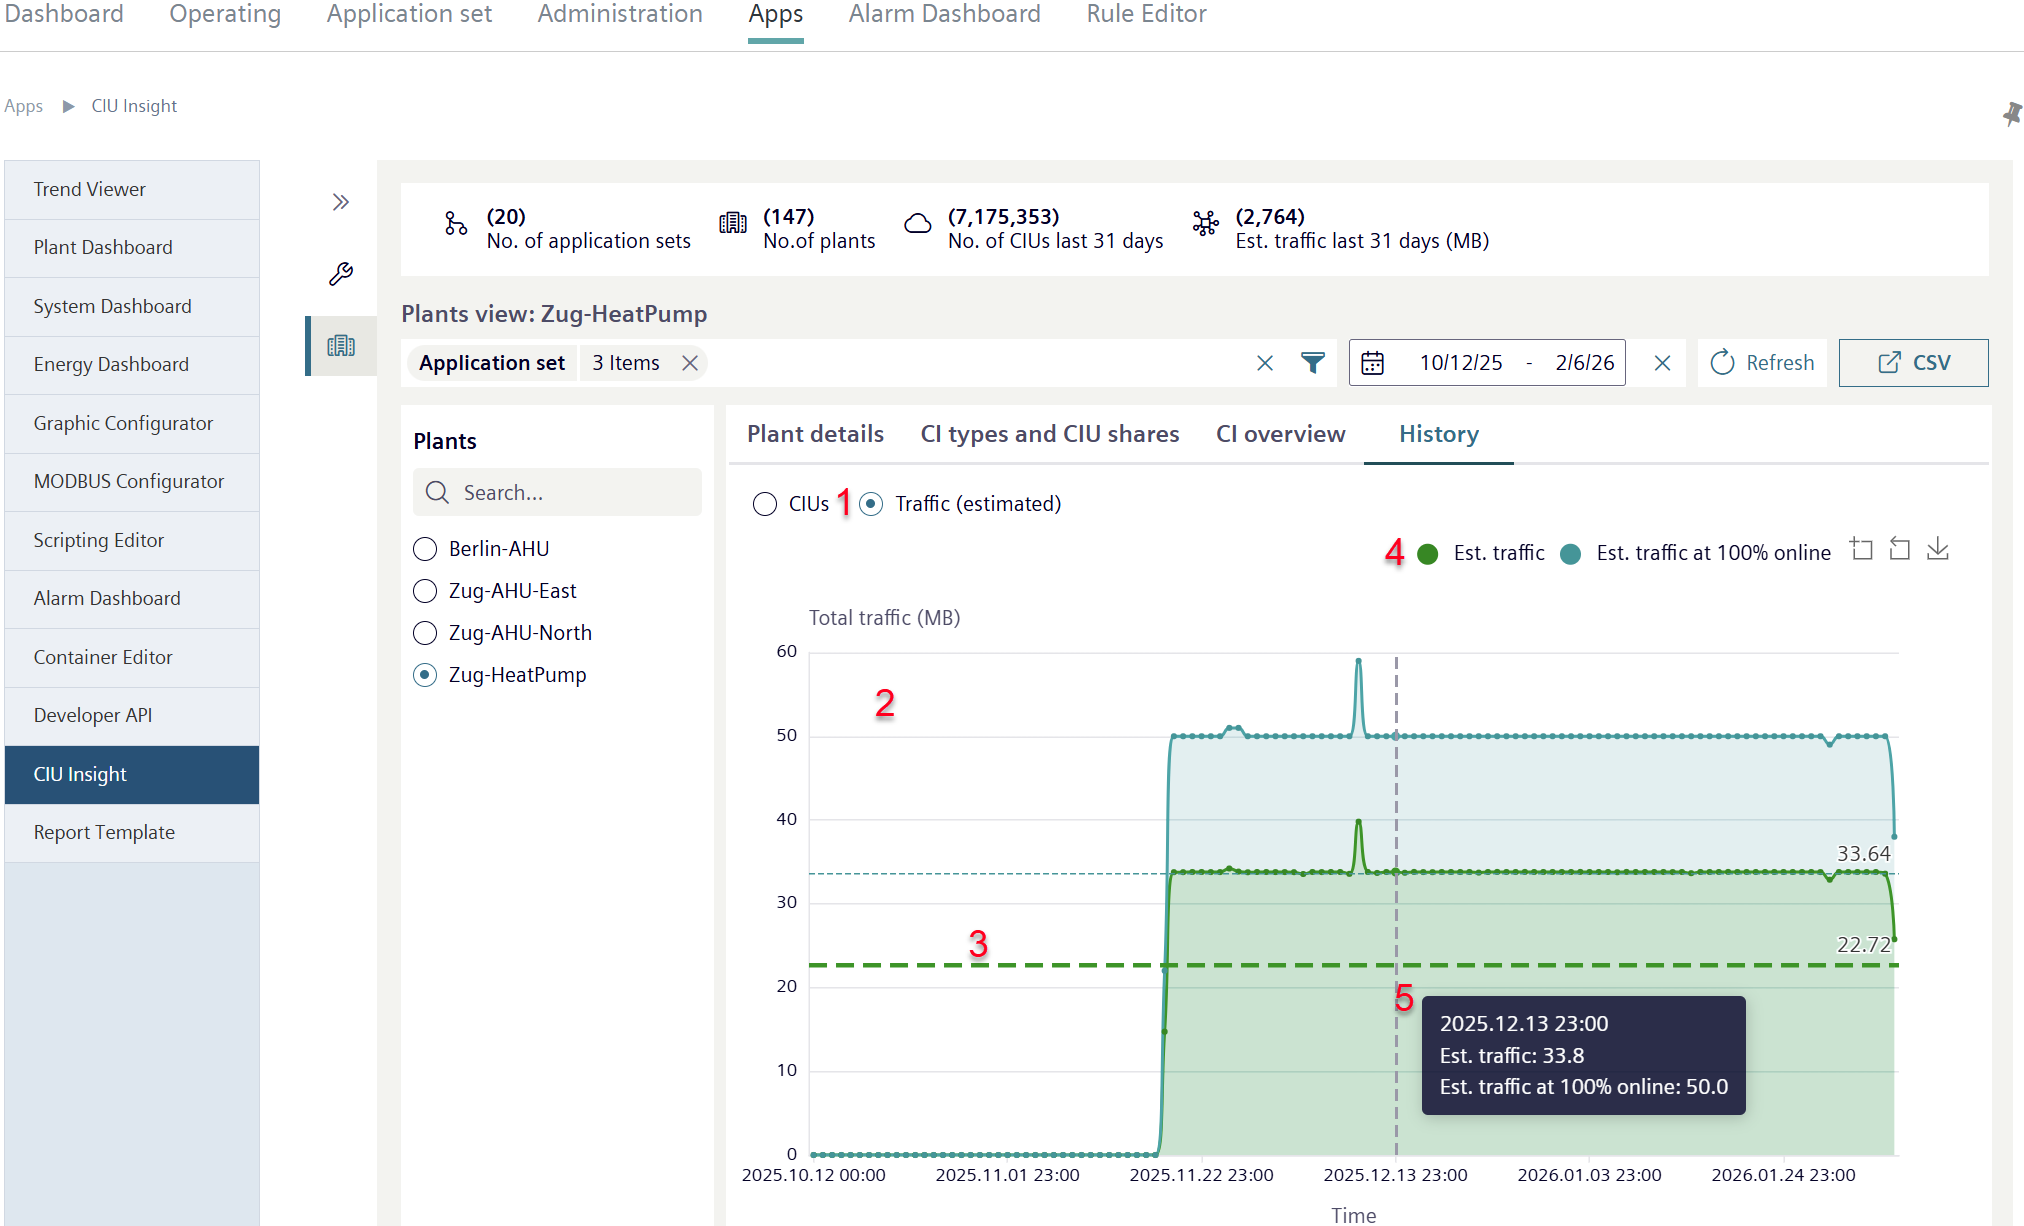
- Click 'Traffic (estimated)' (1).
- A line chart opens (2).
- The line chart shows total Traffic↑ in MB within a selected plant over a selected period and the estimated traffic for the prior that plant was online.
- The dotted line display averages of the data sets (3).
- Click a legend entry (4).
- The data record the legend refers to is hidden from the chart.
- Click the legend entry again to display the corresponding data record.
- Move the cursor over one of the line charts.
- The data value of the segment at the Event time↑ on the timeline is displayed (5).