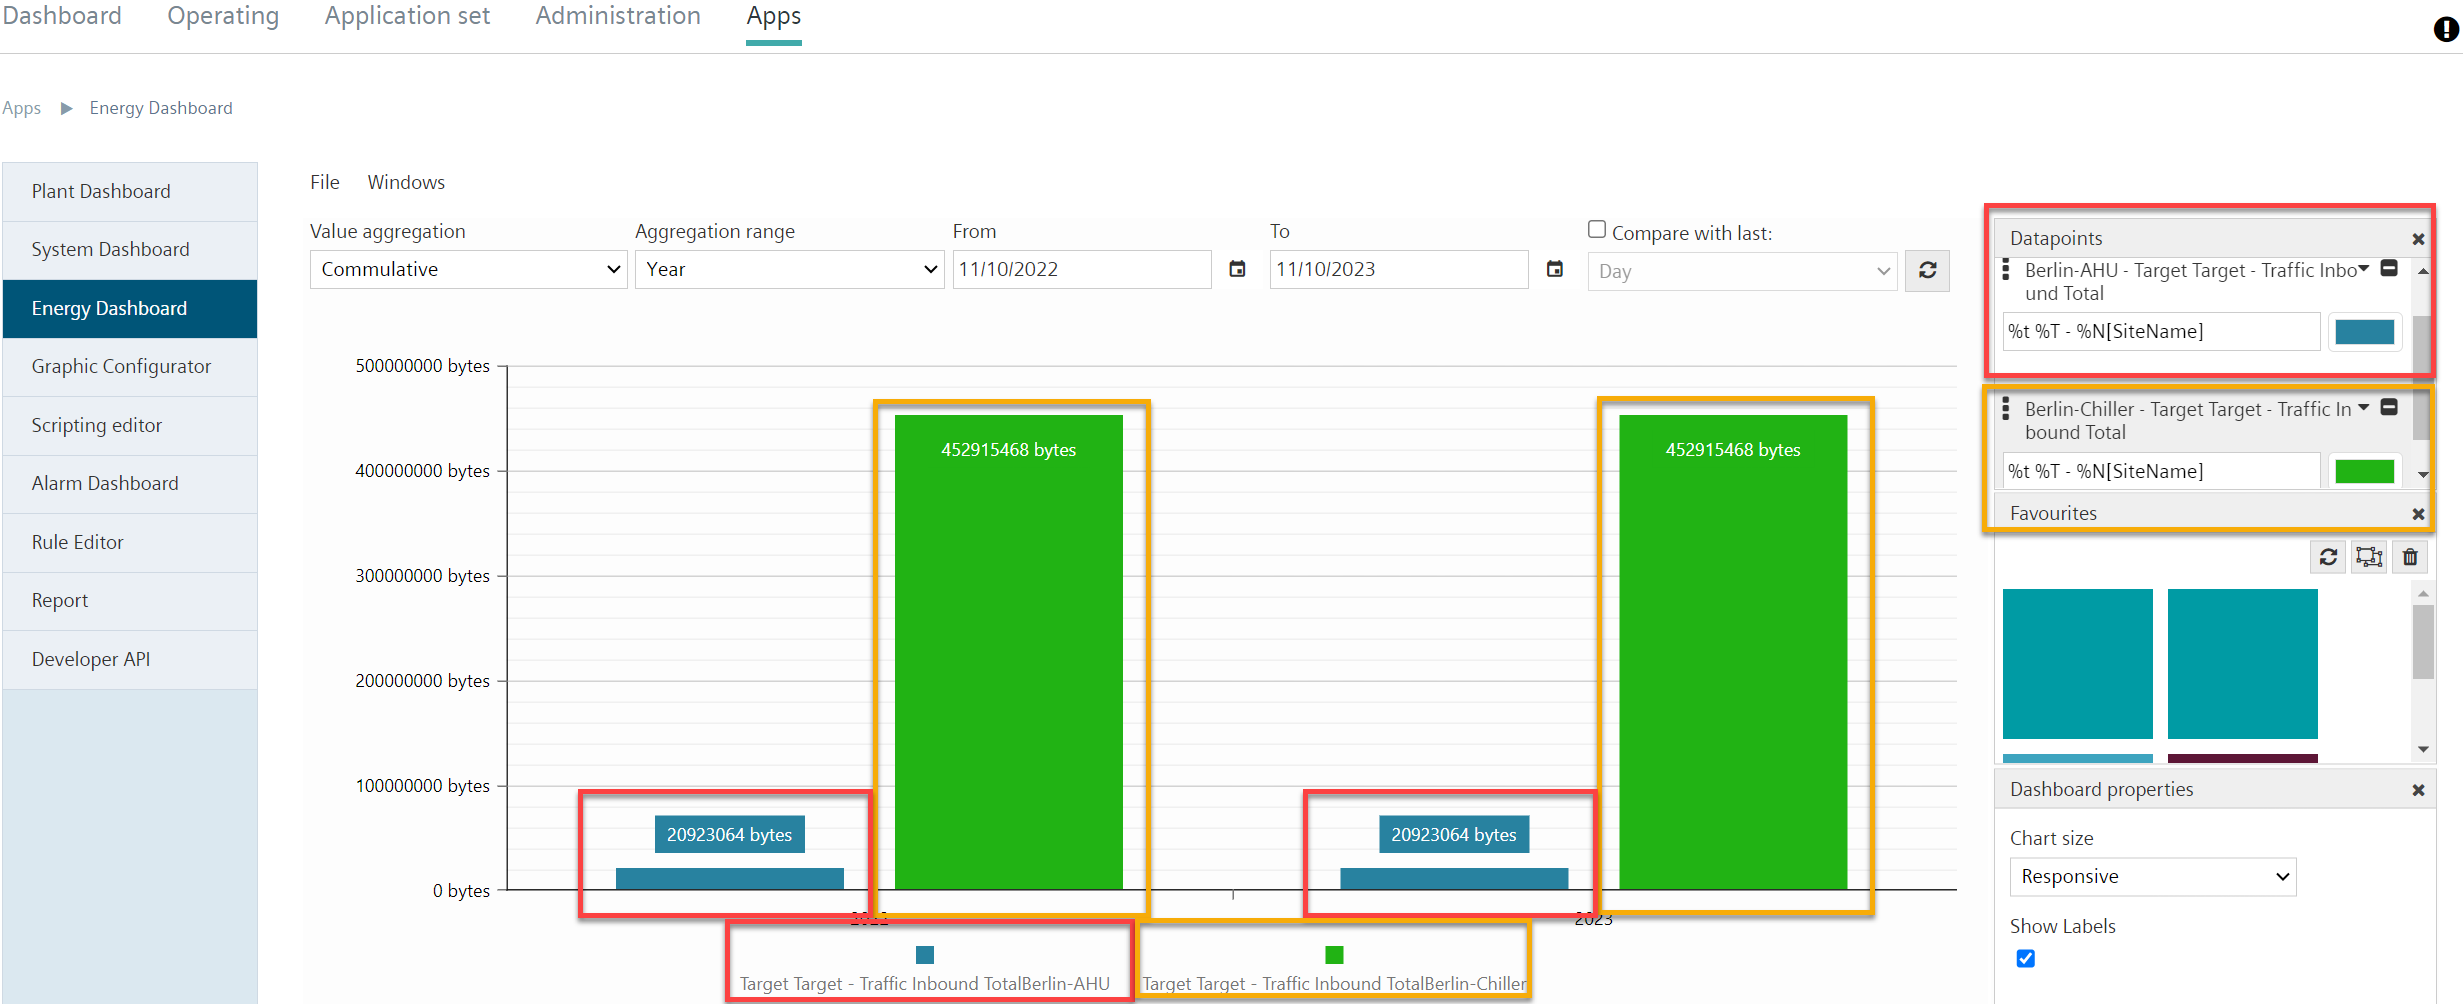
Compare different data points
Several data points can be selected at the same time in the "Data points" menu window. The aim of this function is to display data from different data points in a comparative view in the bar chart to enable a comparative analysis.
- Follow the steps in 'Selecting and formatting data points'.
- Perform these steps for all data points for display.
- Several data points are displayed in parallel in the bar chart.
Use:
- The bar chart is only designed to display energy values. Therefore, select data points that display energy consumption values.
- See also section 'Restrictions' in section 'Energy dashboard'.
- The data points to be displayed in the bar chart can either all belong to one plant or to different plants to be compared.
- Display several data points of a plant in a comparative view in order to compare different parameters within the plant.
- Display data points from different plants in a comparative view to compare the same parameters between the plants.