Energy dashboard
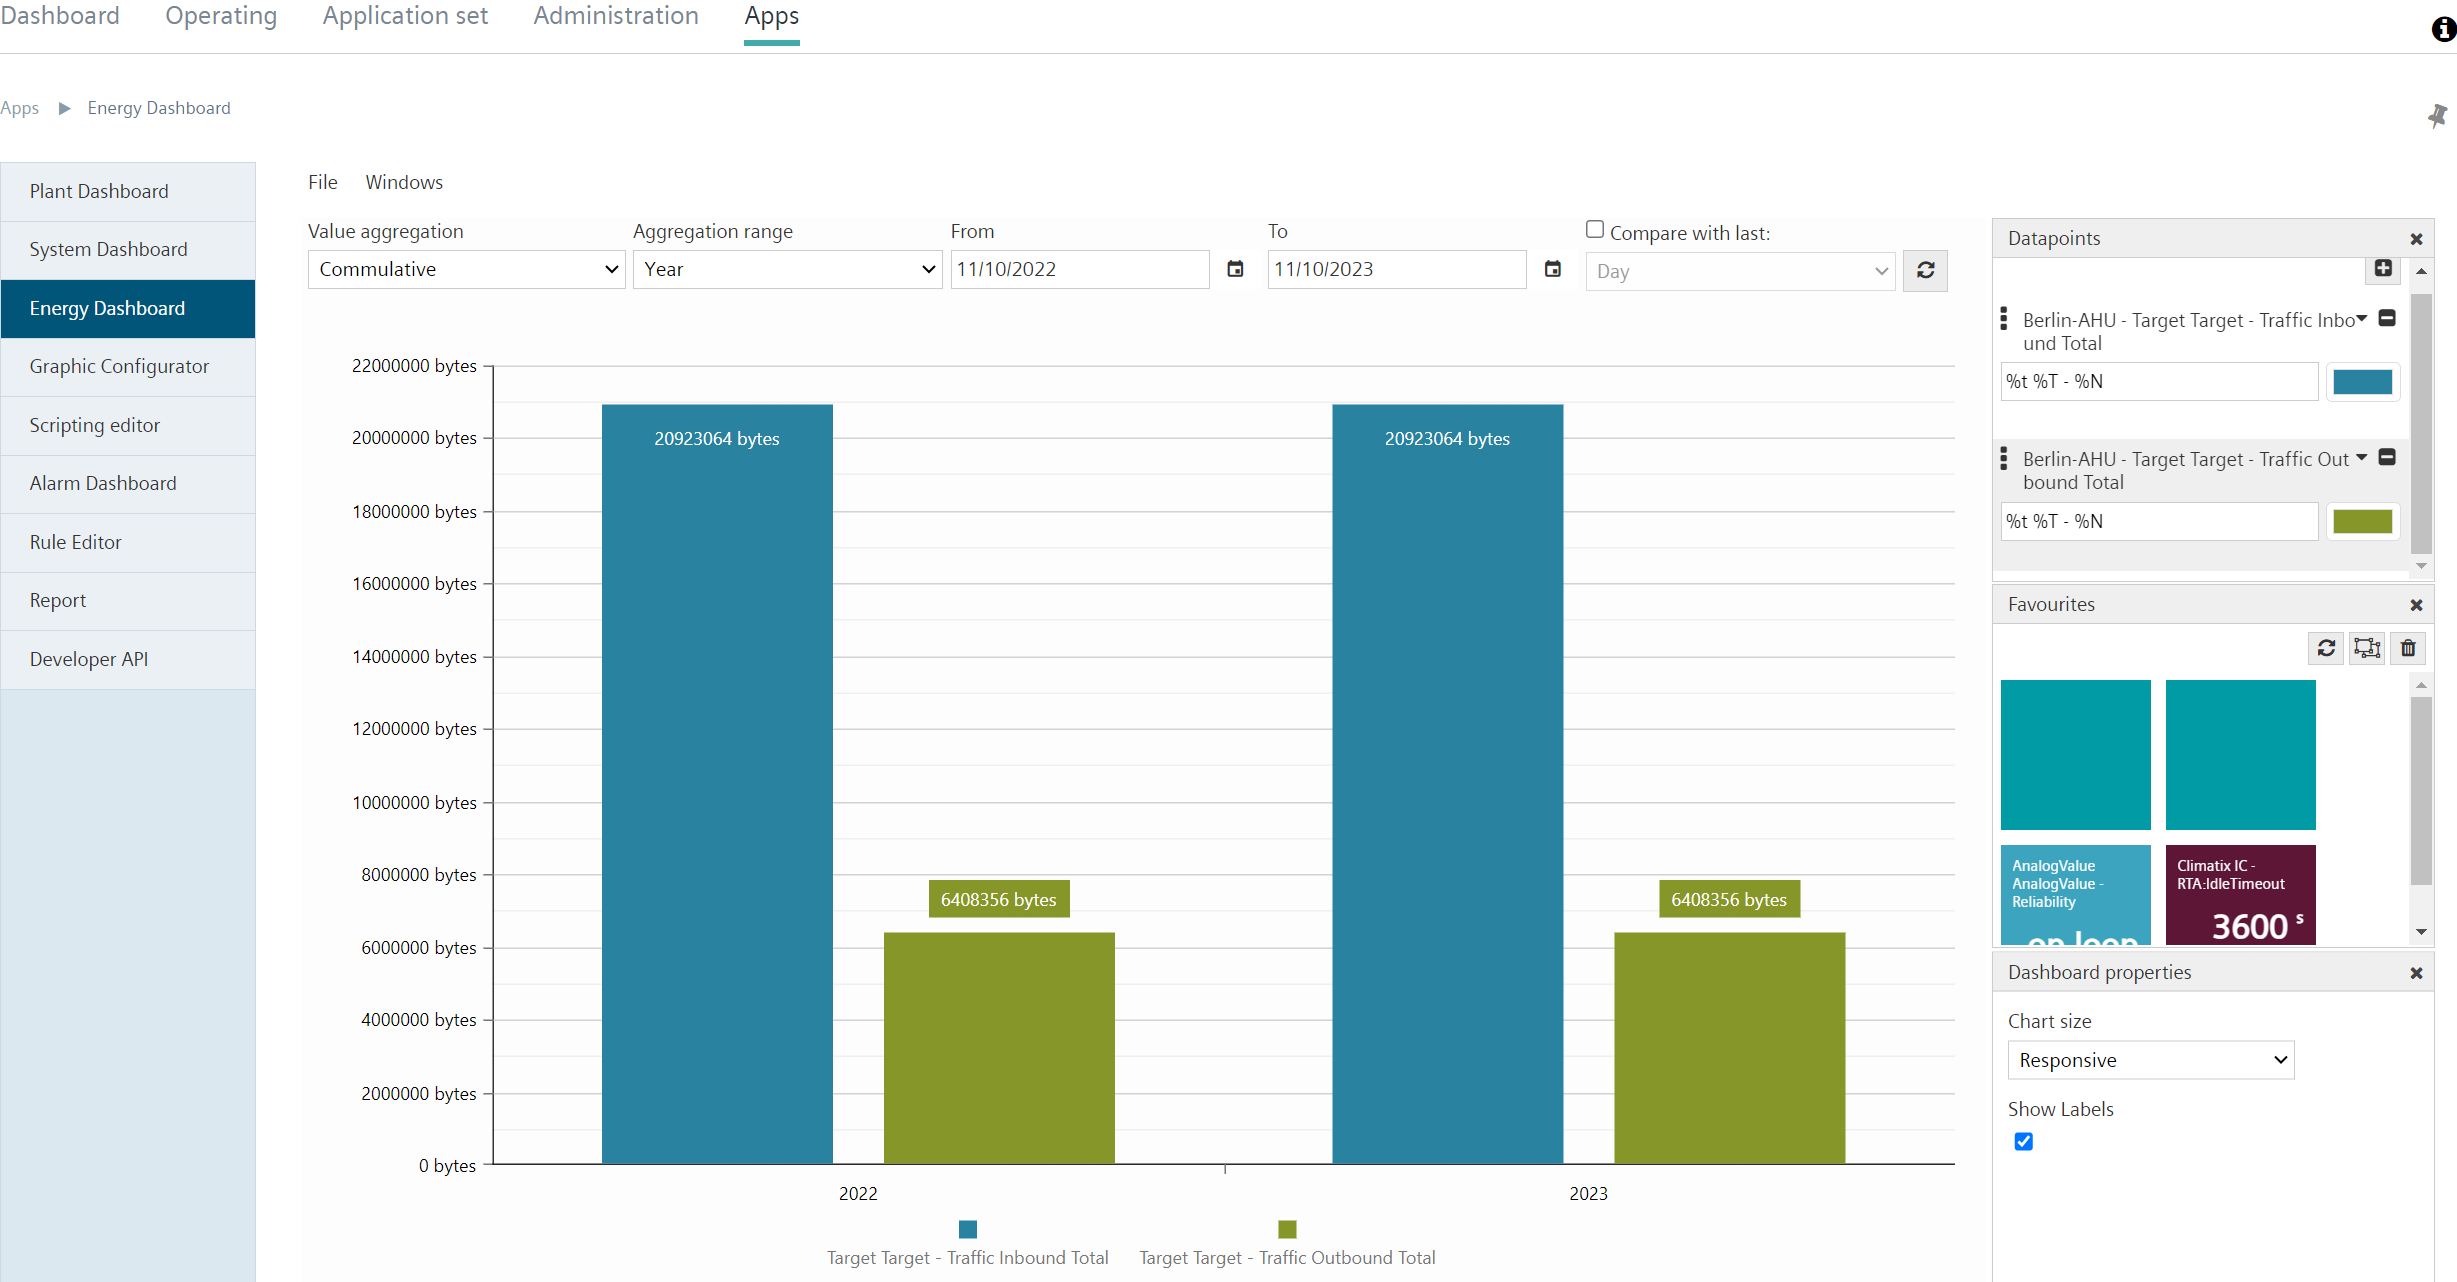
The 'Energy Dashboard’ can create an additional dashboard that is tailored to the presentation of individual data points on energy consumption values in chart form. It serves as an alternative to exporting data to an Excel spreadsheet outside the Climatix IC environment.
Target group and use
The 'Energy Dashboard' function is intended for use by different user roles. The function is always activated in the Tenant by default and can be activated there for the individual, available system roles in the Tenant.
The Energy Dashboard creates comparative views between:
- Different time periods of a data point.
- Various data points.
One or more data points with energy consumption values can therefore be selected, which are then displayed with their value characteristics in a bar chart for comparison over defined periods of time. The comparison function is primarily intended for comparing energy consumption data.
Limitations
- A maximum of 600 COV updates or Cloud-Item↑ updates can be displayed in the Energy Dashboard within a selected time period.
- Data points that do not contain energy consumption data can also be integrated on the Energy Dashboard. However, the Energy Dashboard is not designed for this and does not display a bar chart that can be meaningfully analyzed in this case.