Selecting and formatting data points
Select data points for display
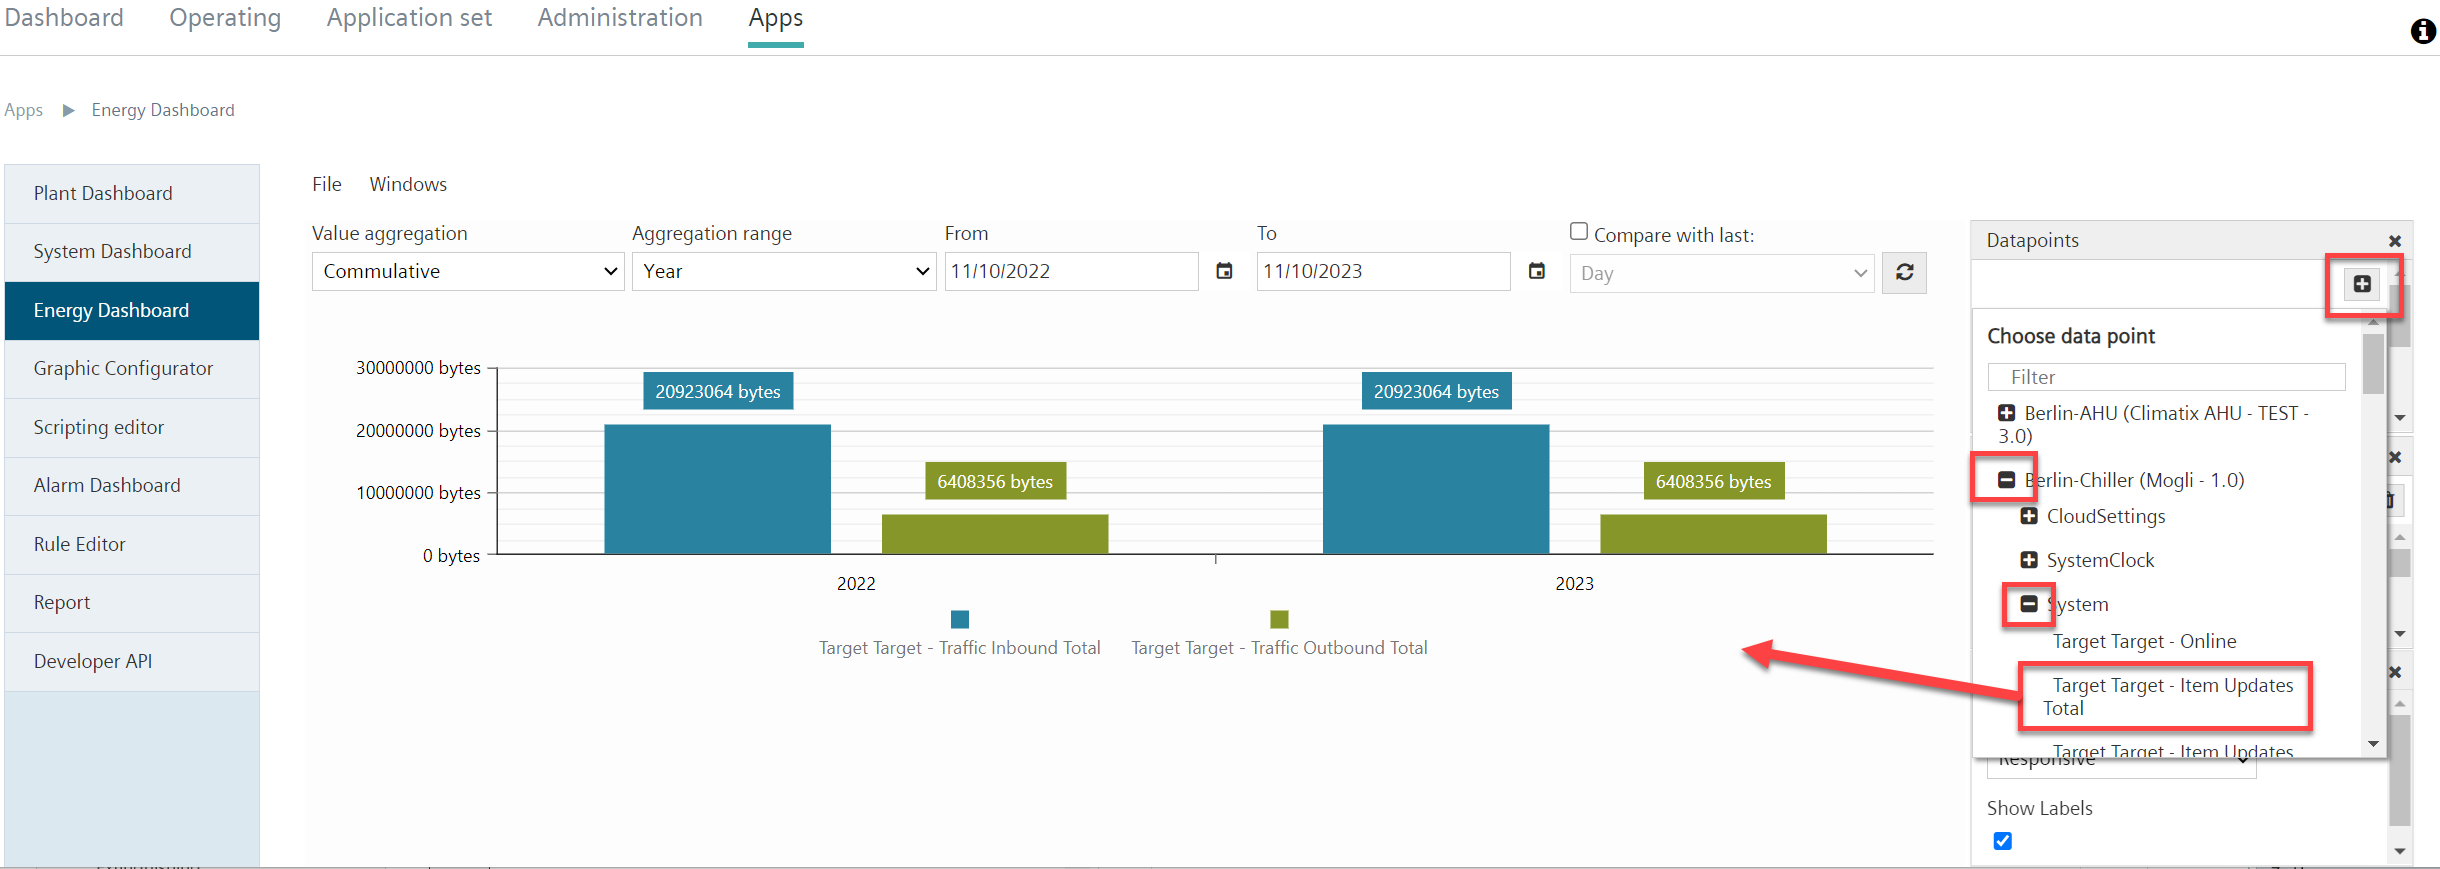
Data points can be selected via the 'Data points' menu window. The procedure here is the same as for selecting data points as for 'Datapoint Tiles':
- Go to the 'Data points' menu window.
- Click the "+” icon.
- Use the filter function or list selection to select the desired plant.
- Click "+" again to display the data points of the selected plant.
- Select the desired data point..
- The selected data point appears in the graphic display of the Energy Dashboard.
Formatting the data point display
The data points displayed in the bar chart can be customized. You can set a key and color for the selected values.
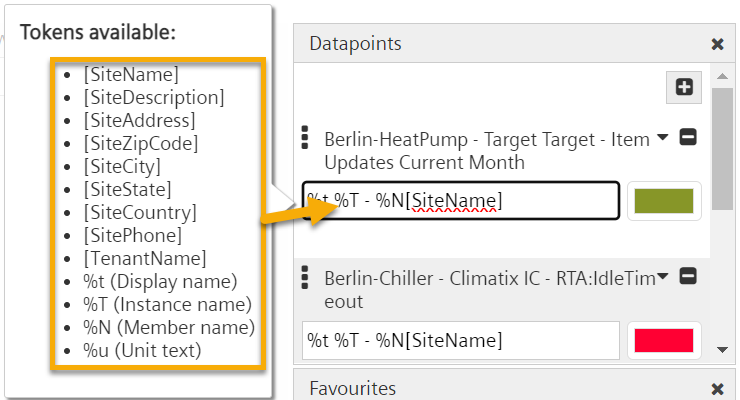
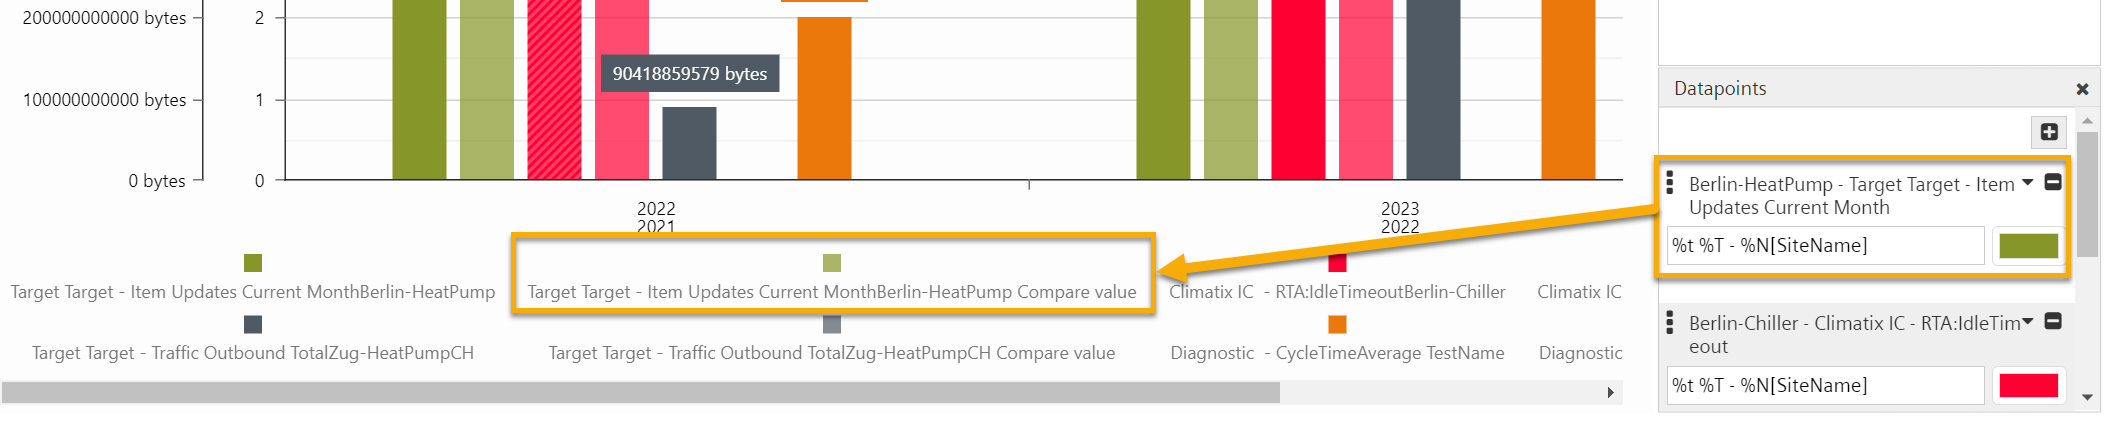
The legend in the bar chart is set in the same way as for the 'Line tiles':
- Go to the 'Data points' menu window.
- Select a data point
- By default, the selected data point is displayed in the bar chart with the preset proper name in the legend.
- Click in the text field next to the data point.
- Select one of the tokens offered to add the token content to the legend label.
- Alternatively: Enter your own free text in the text field.
- Delete token or free text from the text field to remove content from the legend.
- The bar chart is automatically refreshed after entry and the legend is updated.
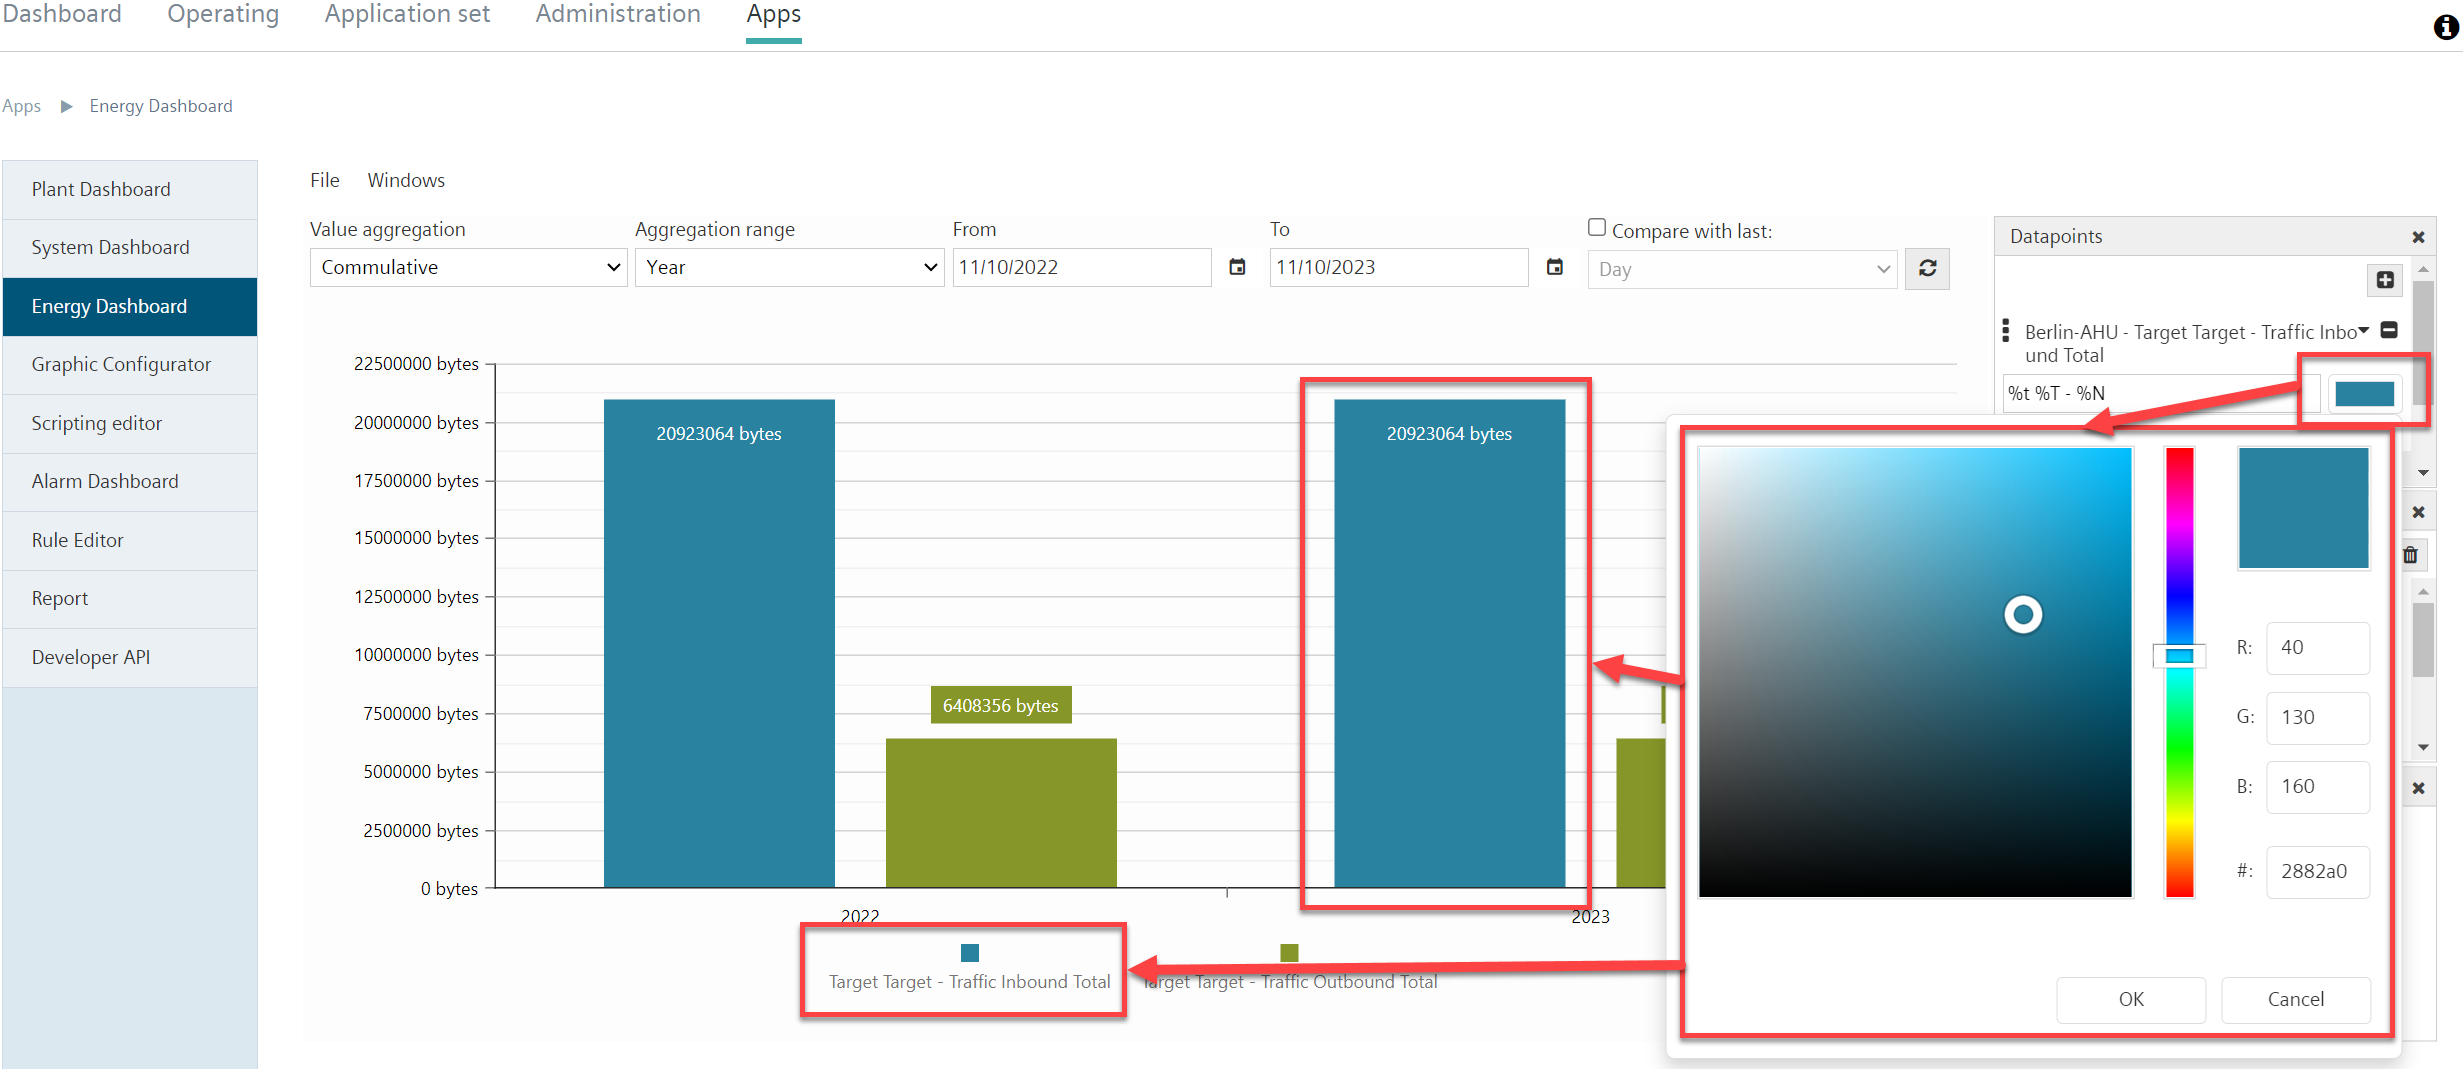
The color selection for the displayed data point is the same as for the 'Bar tile':
- Go to the 'Data points' menu window.
- Select a data point
- Select the color selection field.
- Set the desired color and click OK.
- Click "Refresh”
 .
.
- The display of the data point in the bar chart is assigned the set color.
Delete data point from diagram
- Go to the 'Data points' menu window.
- Select the data point to be deleted.
- Click the "-” icon.
- Click "Refresh” .
- The data point is deleted from the diagram.