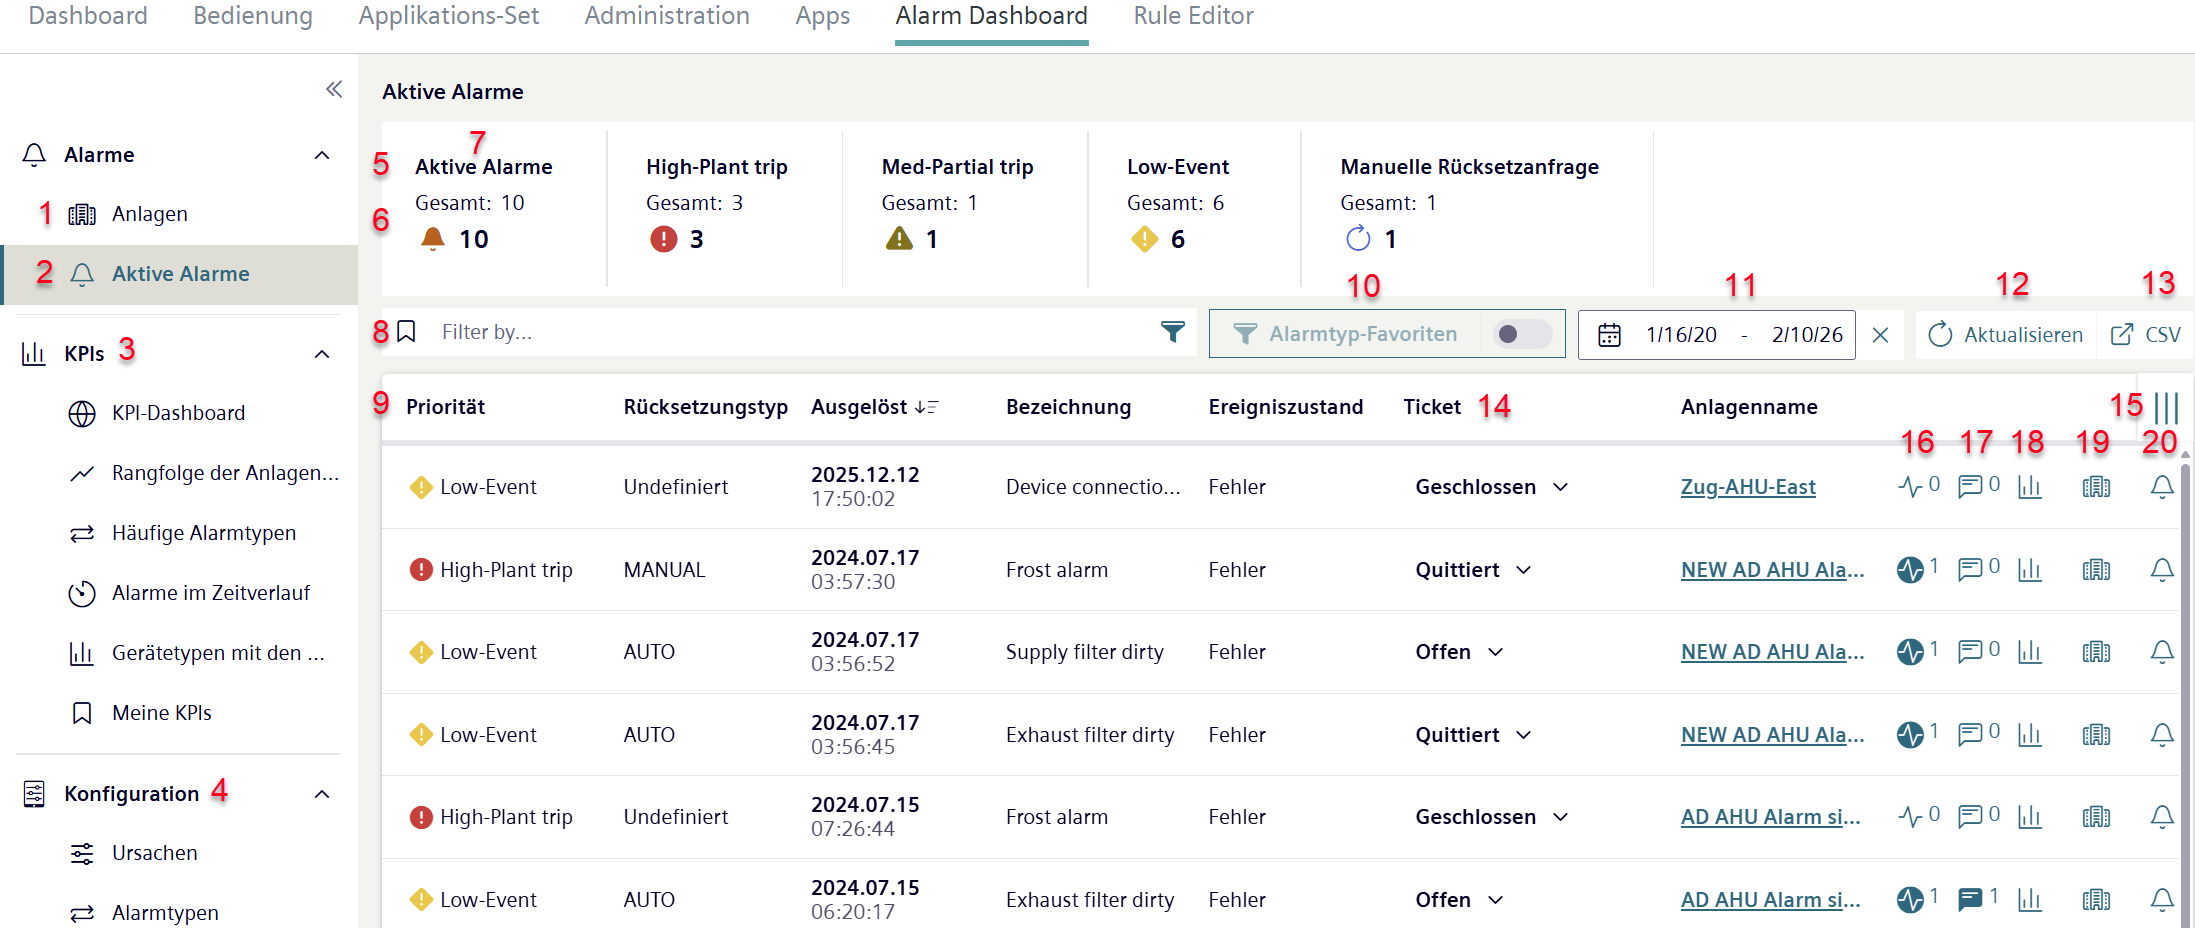
Intelligent Alarm Application (IAA) user interface
No. | Property | Description |
1 | Plants - Plant alarm history | Active and historical alarms↑ on a plant level (organize measures operationally). |
2 | Alarms - Active alarms | Active alarms on a Tenant level (concentrate and prioritize, operationally). |
3 | Access to KPIs (statistical overview): | |
KPI dashboard (graphical overview). | ||
Ranking by alarm (donut chart). | ||
Frequent alarm types (donut chart). | ||
Alarms on a time axis (line diagram). | ||
My KPIs. | ||
4 | Configuration | Access to the configuration (Engineering): |
Root causes (Configuration of root causes). | ||
Alarm types (Configuration of alarm types). | ||
5 | Alarm type | Alarm severity:
|
6 | Number of alarms | Counter of all alarm states:
|
7 | 'Active alarms’ column | Counter of the alarm states stored in the current filter, broken down by alarm type. |
8 | Filter by... | Filters the alarm list by selected predefined properties, such as priority, location, name, Tenant, etc. Filters set up by the end user are automatically saved in the background until the next time a filter is applied. Filters are used in the functions::
Overview of available filters: See : 'Advanced filter search by plants with an alarm'. To save net filters permanently for later use: See 'Permanently saving filters'. |
9 | List of active alarms and alarm properties | Priority Displays the alarm priority. |
Reset type Displays alarm resets by type. | ||
Triggered. Displays the date and time the alarm was registered in the Climatix IC. The time stored in the browser applies. | ||
Triggered in the plant Displays the date and time the alarm was triggered in the plant. | ||
Designation Indicates the name of the alarm. | ||
Event state Indicates the reason the displayed alarm was triggered. | ||
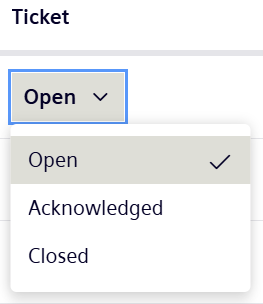
Ticket Indicates whether the user marked the alarm root cause as 'Acknowledged' or 'Closed' (see item 14). | ||
Plant name Plant name that triggered the alarm. | ||
Address Displays the site address. | ||
10 | Alarm type favorites | Filter for alarms marked as "Favorite": See 'Setting favorite alarm types and filtering lists with plants by alarm type'. |
11 | Timeframe | Displays alarms triggered within a specified period. |
12 | Refresh | Updates displayed alarms. |
13 | CSV | Export CSV files: |
14 | Ticket | The state of the Ticket↑ can be selected manually:
Plant details display on which user changed the ticket status at which time (See 'Details'). The attribute 'Ticket' is an additional filter criterion: In the filter function in Climatix IC, plants can be filtered by ticket status 'Open', 'Acknowledged' and 'Closed'. Note: Changing the ticket state has no effect on the alarm status in the plant. |
15 | Modify III columns | Select or clear the columns to display in the overview. |
16 | Number of root causes | Access to 'Causes' with a counter for the number of root causes.
|
17 | Number of comments | Access to the 'Comments'menu with a counter for the number of comments.
|
18 | Time series chart | Access to 'Chart’ menu. |
19 | Plant details | Overview of the 'Plant details'. |
20 | Alarm history | Overview of triggered alarms for the plant ('Alarm history'). |