View of plants with an alarm
Overview of your plants with an Alarm↑:
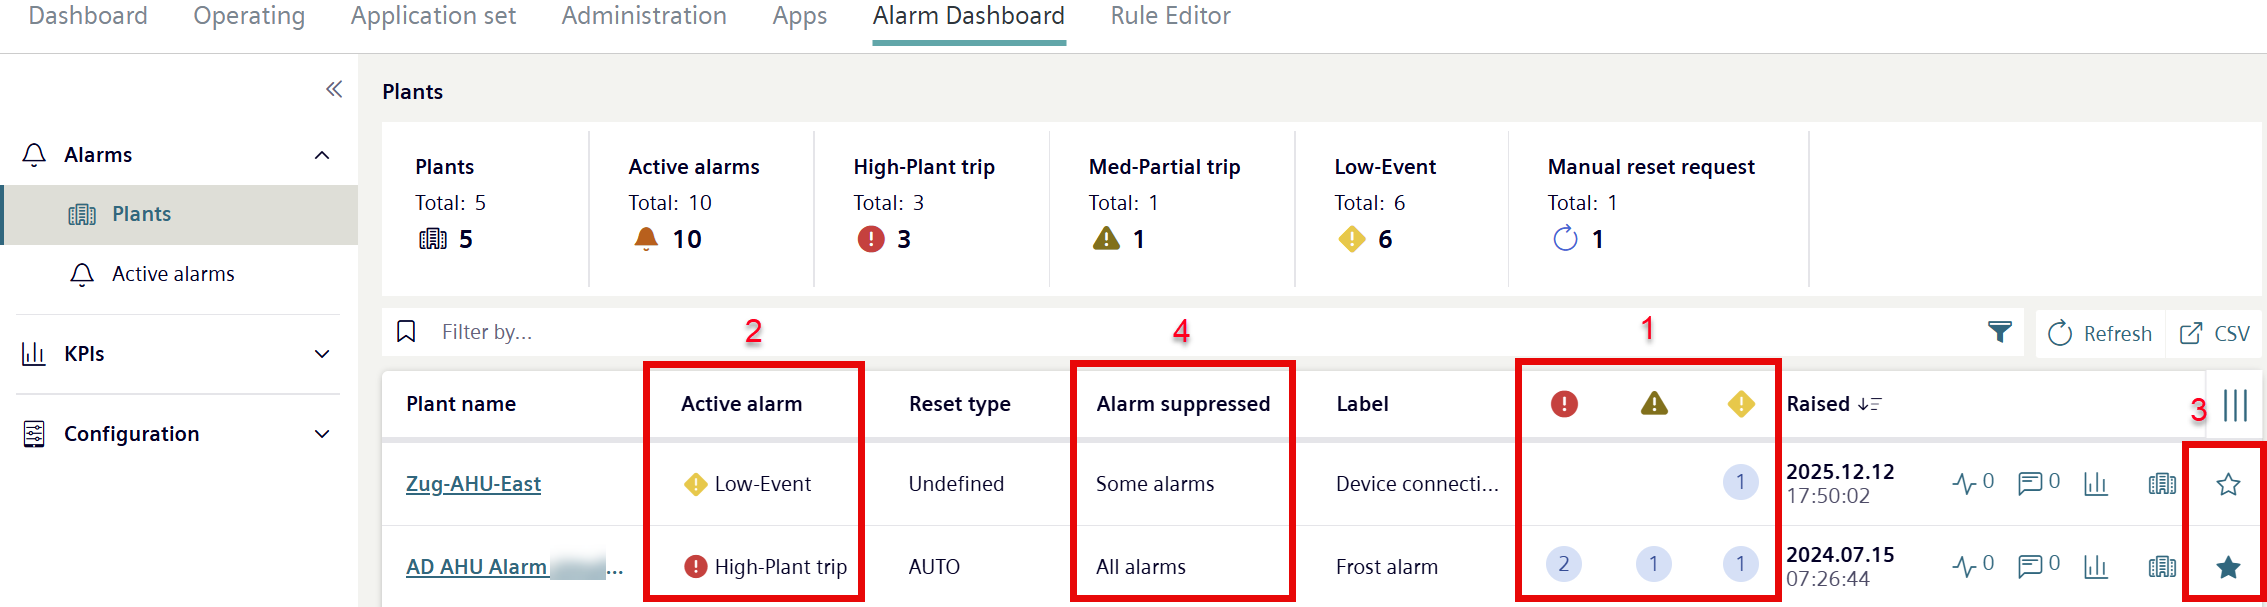
- List of the number of alarms per plant by priority (1).
- The displayed active alarm is always the alarm with the highest priority within a plant (2).
- 'Mark an alarm as a 'Favorite'' by clicking the icon
 (3).
(3). - The additional status 'Favorites' can be applied as another filter criterion in 'Advanced filter search by alarm'.
- A list of plants with alarms that are partially or completely suppressed (4).
- See 'Suppress alarms'.
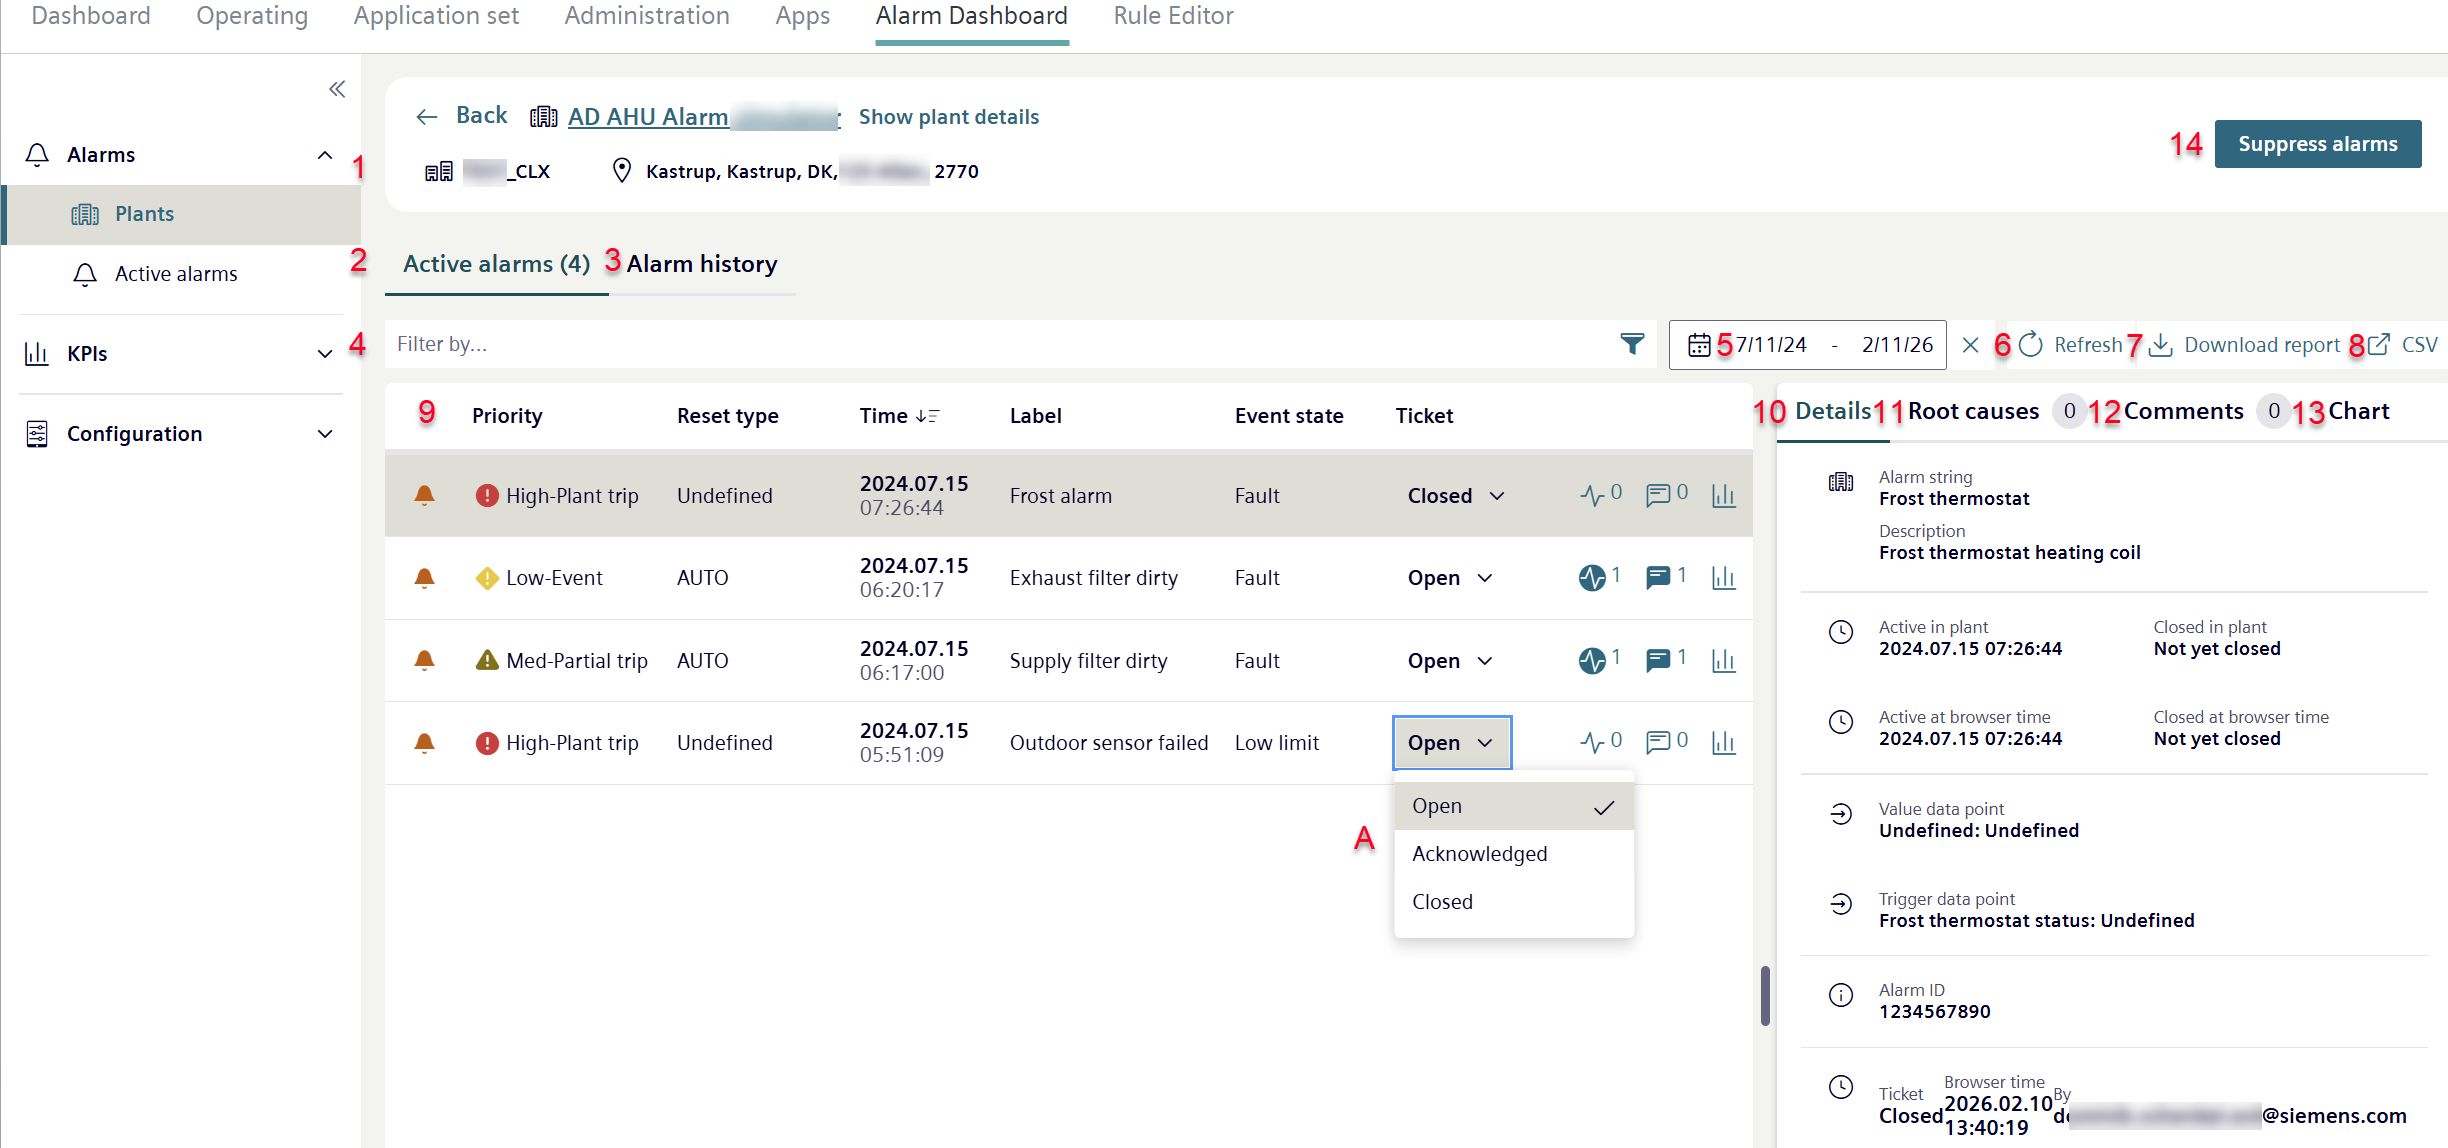
When selecting a plant, the list of active alarms for that plant opens:
Number | Function | Description |
|---|---|---|
1 | Plant | It displays the plant that triggered the alarm as well as additional plant information, such as Tenants and location.
Plant details: See 'Plant details'. |
2 | Active alarms | Chronological list of active alarms of all types on a plant. |
3 | Alarm history | Chronological list of open and closed alarm events on a plant. |
4 | Filter by... | Opens 'Advanced filter search’ (see 'Advanced filter search by alarm'). Filters the alarm list by predefined properties priority, reset type, designation, event state, root causes and comment. Multiple filters can be added. |
Saved filters |
| |
5 | Timeframe | Displays alarms triggered with a specific period. |
6 | Update | Updates displayed alarms. |
7 | Download report | Generates a report with all alarms for the plant as .odt text file (.odt = OpenDocument Text). |
8 | CSV | Generates a report with all alarms for this plant as a CSV file download. |
9 | Alarm list | Alarms can be sorted by clicking the table header. |
Status Displays the state of the alarm.
| ||
Priority Displays the alarm priority. Details: See 'Priorities in the alarm list'. | ||
Reset type Displays alarm resets by type. | ||
Time Displays the date and time the alarm was registered in Climatix IC. | ||
Designation Indicates the name of the alarm. See also 'Alarm type'. | ||
Event state Indicates the reason the displayed alarm was triggered. | ||
Ticket The user can highlight an alarm as 'Acknowledged', 'Closed' or 'Open' (A). Operation and purpose of tickets↑: See 'Intelligent Alarm Application (IAA) user interface'. | ||
10 | Details | Displays all details on an alarm. Note:
|
11 | Causes | Displays the number of recommendations that are defined for an alarm. The display is based on the selected alarm in the list. |
12 | Comment | Displays the number of comments that are defined for an alarm. The display is based on the selected alarm in the list. |
13 | Displays the progression of the "Event status↑" and the "Data point value" curve as a chart over a specific period. Offers different views and options to export displayed data. | |
14 | Can suppress alarms in a plant in part or completely, either for a limited or unlimited period. The function prevents the frequent occurrence of alarms, such as during a testing or maintenance phase of the plant. The filter function can filter plants by suppressed alarms. |
 to switch to the Plant Dashboard.
 Active alarm
 Alarm already closed
 Alarm closed

