Ranking of plants with a large number of alarms
The "Ranking plants" function can:
- Sort plants by the amount of incoming alarms↑.
- Number of incidents per plant.
- Rank the frequency of occurrence alarm types within a plant.
- Go to menu "Alarm Dashboard > KPIs > Ranking of plants with the highest number of alarms".
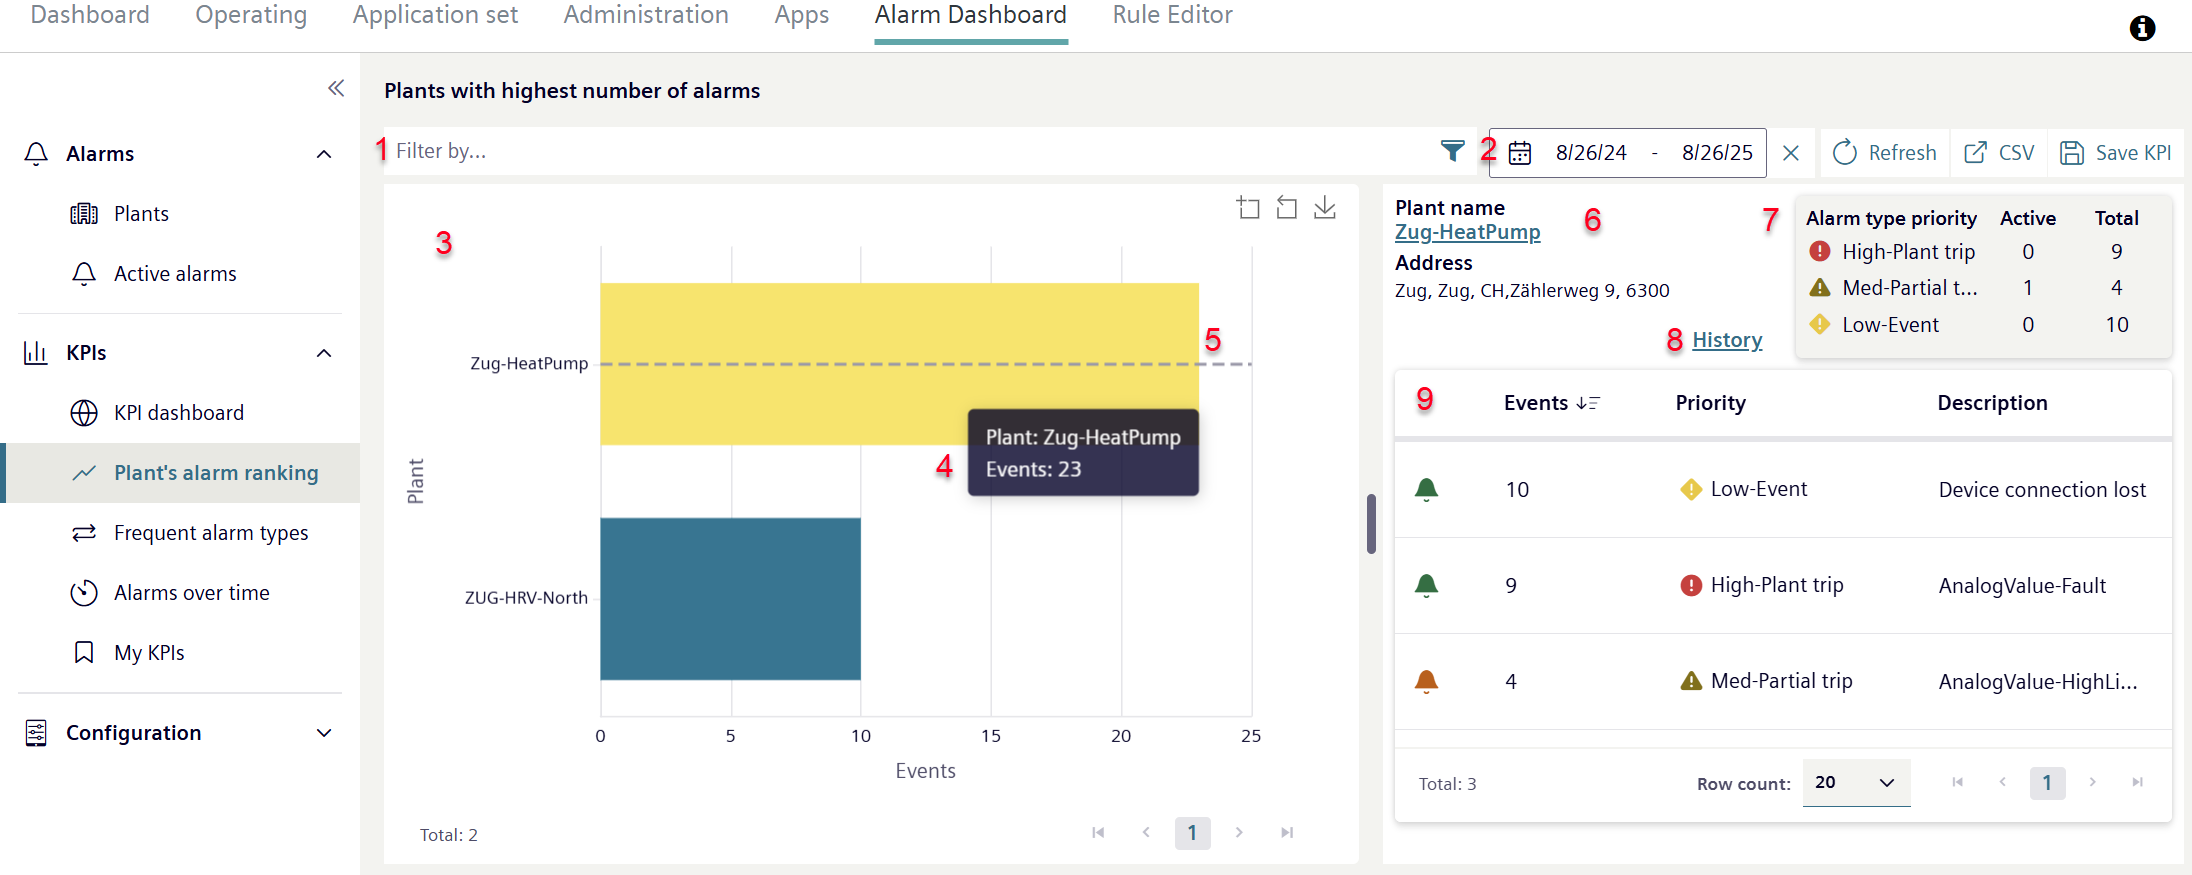
- Select one or more desired alarm types using filters (1).
- A new window 'Advance filter search' opens.
- Filter desired plants (see 'Advanced filter search by plants with an alarm').
- The number of displayed filterable plants depends on the selected period (2). Only plants with an alarm within the selected period can be selected and displayed using filters.
- Click 'Apply' to apply the filter.
- Indicate the period (2) to display plants with an alarm.
- The larger the period, the higher the probability of finding plants with alarms.
- The filtered plants display in a chart (3).
- Each bar in the chart represents a plant that has alarms.
- The size of the bar represent the number of plants during the selected period.
- Move the mouse pointer over individual bar chart.
- Displays the plant name and frequency of alarms occurring in the plant (4).
- Select an individual chart bar by clicking it.
- The selected bar is highlighted in color (5)
- The default view is always the plant bar with the highest number of alarms.
- Details of the plant highlighted in the chart (6) display.
- The priorities of the alarms of plants highlighted in the chart are depicted as a list (7).
The total number of alarms, number of active alarms and priority of reported alarms in the plant display. - A list of alarms within the plants highlighted in the chart displays (9). It provides an overview by name, description and number of individual alarm types for the plant.
- Click "History" (8).
- A new window opens with the 'Active alarms view' of the plant highlighted in the bar chart.
- Click 'Events↑', 'Designation' or 'Description' (9).
- The plants are sorted according to their attributes.
- Click the plant name (6) to change to the "Plant Dashboard" for the plant.
- The "Operation" menu opens in a new window and displays the Plant Dashboard.