Device types with the most alarms
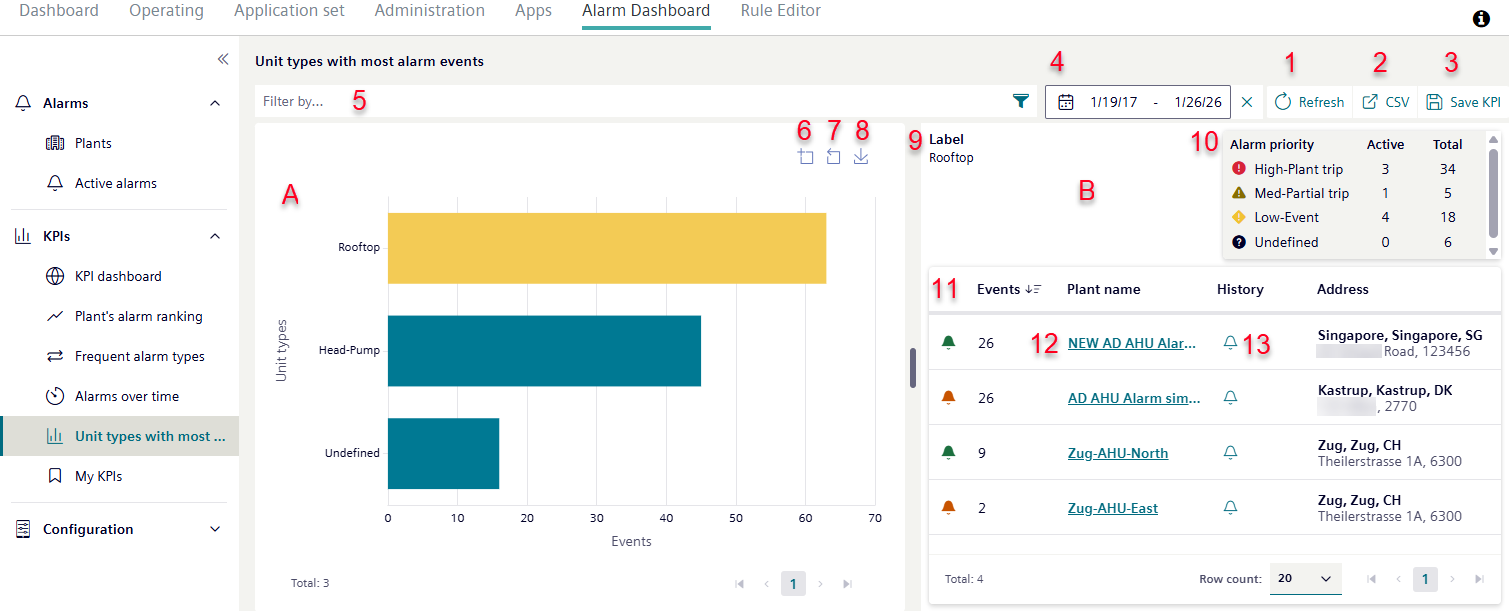
The 'Device types with the most alarms' function provides a quick and easy overview on the number of alarms↑ per device type within a Tenant. It displays all alarm events in a Tenant↑ on a chart, broken down by device type.
- The user assigns the attribute 'Type' to the plants↑ (see 'Type').
- Different plants with the same attribute type become one device type.
- All devices of the same type registered in the Tenant are displayed in a summary.
- One device type corresponds to one bar in the chart.
It can be filtered by devices type that have had an alarm event.
The overview can be exported as a CSV file.
Operate overview page
- Click '' (1).
- The overview page refreshes.
- Click ' CSV' (2).
- The data as displayed in the overview page is exported as a csv file to a local drive.
- Click ' Save KPI↑ (3).
- The parameters currently set for view control (filter or similar) are saved to the browser.
- The same view settings apply the next time the page is opened.
Set the number of device types for display
- The attribute 'Type' is assigned to the plants.
- Plants with the attribute 'Type' have active or historical alarm events.
- Go to 'Alarm Dashboard > KPIs > Device types with the most alarms'.
- Set the period to display alarm events (4).
- Set filters by which the plants with alarm events should be filtered (5).
- Click 'Filter by ... :’ to open the dialog box with available filters.
- Apply the 'Unit types' filter to reduce the number of plant types displayed in the chart:
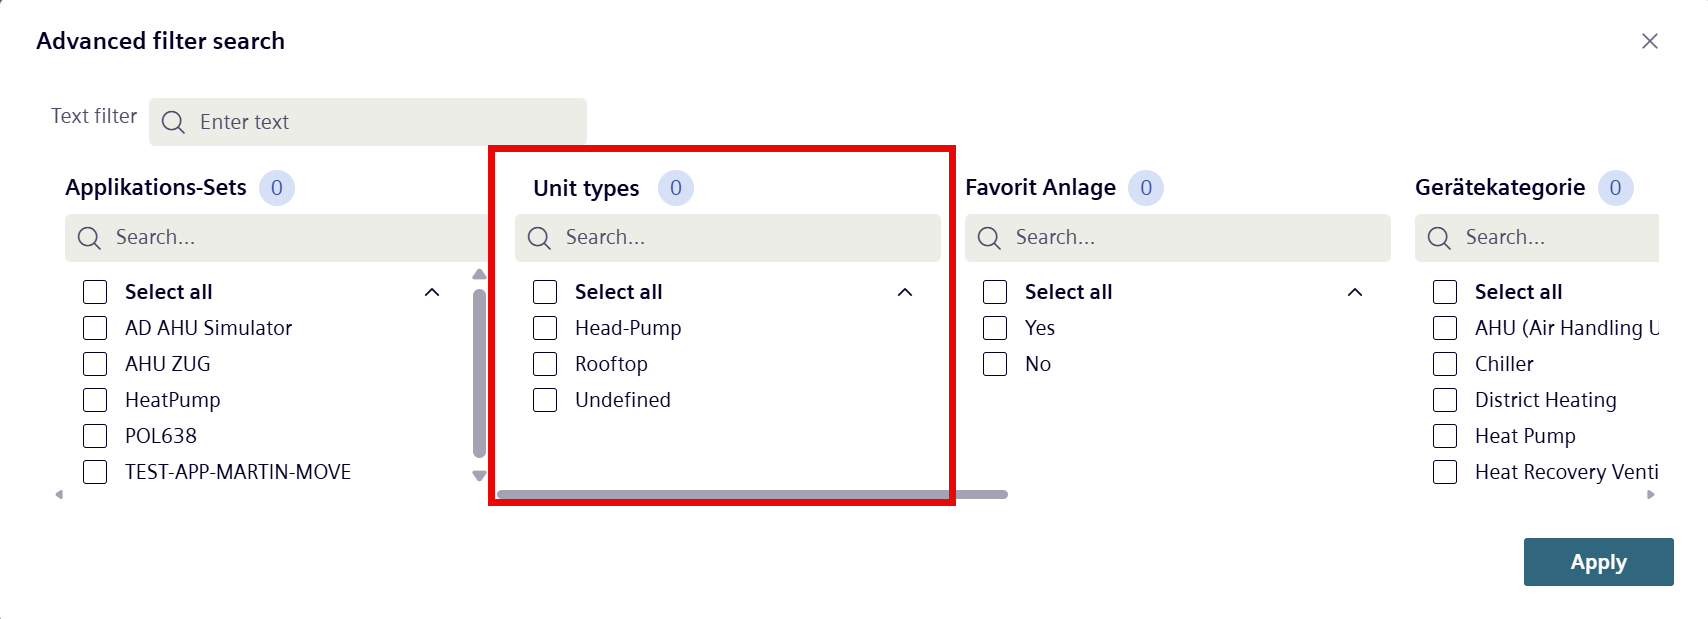
Chart view of the device types
- Click '
 ’ to increase the diagram view (6).
 - Click '
 ’ to return to the original diagram view (7).
 - Click '
 ' to export the chart as .png graphic to the local computer (8).
Display detailed information on device types
- In the chart on the left-hand side, click a bar of a displayed device type (A).
- The details view on the right-hand side of the window displays information on the selected device types (B).
'Designation' displays the name of the selected device type (9).
'Alarm priority' displays the number of alarms of the selected device type, broken down by alarm priority, status 'Active' and by total number (10).
'Events↑' Events↑' displays individual plants assigned to an alarm type (11). - Click another device type bar in the diagram on the left side (A).
- The details view on the right-hand side is refreshed with the latest information on the newly selected device types (B).
- In the 'Events↑’ field, click the header (11).
- The displayed plants are sorted by attribute, alphabetically or numerically in ascending order.
- Click the heading again.
- The displayed plants are sorted by attribute, alphabetically or numerically in ascending order.
- Click the plant name (12).
- A new window opens in the Plant Dashboard view (see 'Plant Dashboard').
- Click the symbol '
 ' (13).
 - The history of the system alarms opens (See 'Alarm history').