System graphics
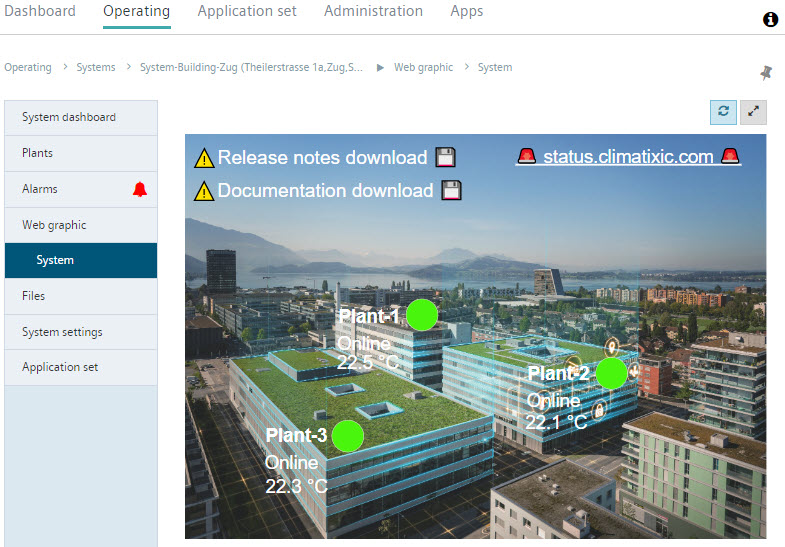
Web graphics can also be created for systems (the same as for plants). System web graphics provide a synoptic overview of the most important information on system plants.

System web graphics are created in the same manner as plant web graphics. Compare the previous chapters "Setting up the desktop", "Working with texts", "Rendering dynamic with mappings", "Hiding").
Rendering dynamic with mappings
Only system plant controllers are integrated in a system web graphic. References to plant data points are hidden.
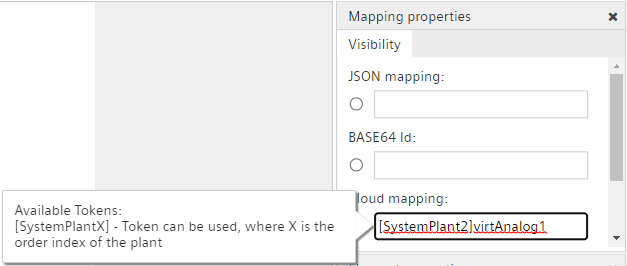
A system may occur from multiple system plants with the same data point designations. A simple query of the data point designation may be non-unique. As a consequence, the system token [SystemPlant{x}] is prefaces to the data point designation. {x} is the index of the system plant in the system.
Mapping to system data points
- You selected a system for your system web graphic. The mapping refers to the plants for this system.
- The index of system plants can be viewed at "Administration > Systems > [my system] > System plants > Column: Index".
- Map the system data points as per "Rendering dynamic with mappings".
- Add the prefix to the data point designation [SystemPlant{x}], where {x} is the index of the desired system plant.
- In the image below, the system plant is referenced Index 2.

For more information on systems, see "Systems: Overview".