Operation menu
System overview
Menu 'Operation > Systems' displays available "Systems", including any assigned information, such as name, description, application set, address, Alarm↑, and online status.
The systems display the common state of all assigned plants. A plant with a notification, such as alarm, is also supplied in the overall state of the assigned system.
The 'Systems' tab is only visible to users with system rights. Only plants are displayed to other users.
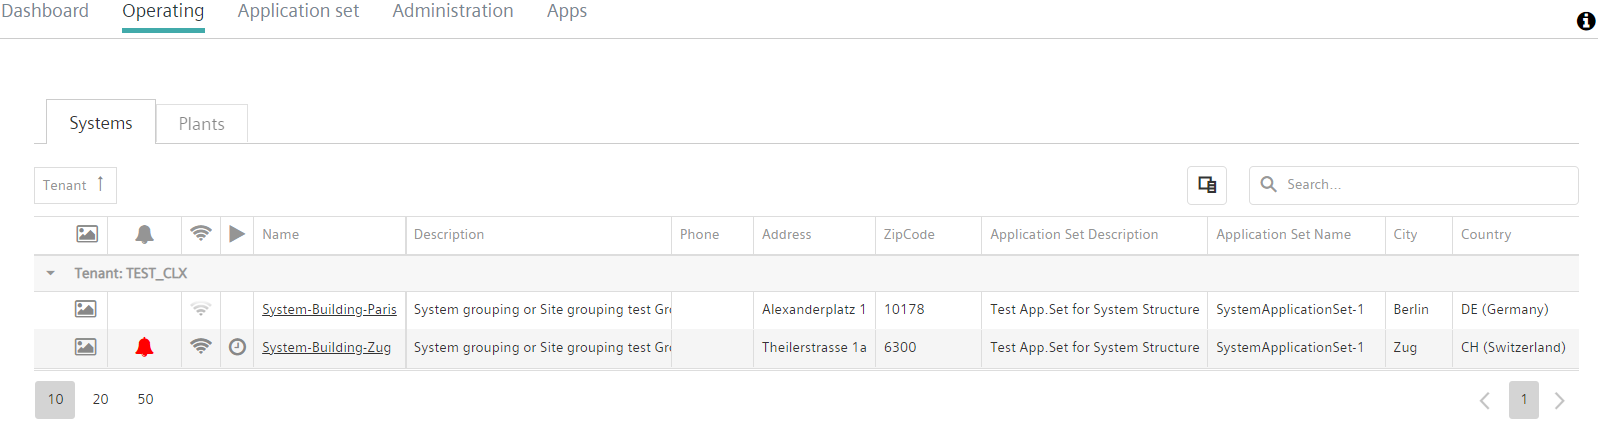
Click a system name to go to that System Dashboard. You can access the system overview for the selected systems to include assigned plants, web graphic, files loaded to the system, system settings, and application sets.
The plants displayed in the System Dashboard can be set up in the Main-Tenant or Sub-Tenant.
Plant overview
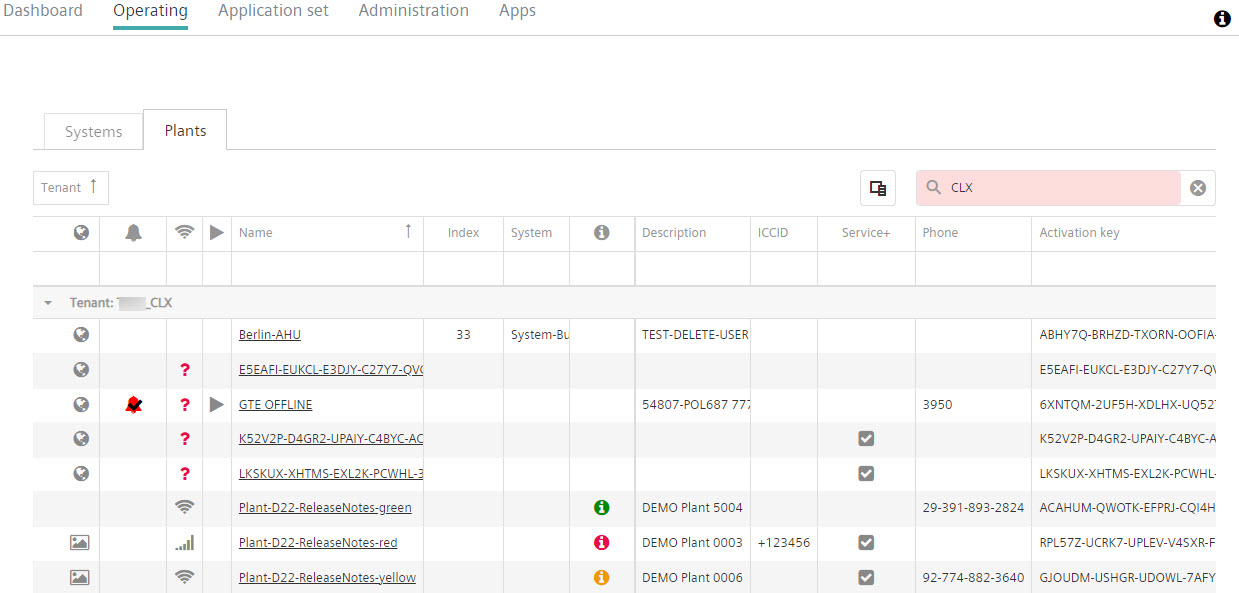
Available plants are displayed in the 'Operating > Plants' menu. The plants are identified by name, description, application set, address, alarm and online status.
Additional information
"Search, sort, group” in the Appendix includes operating notes that help you modify comprehensive lists to improved usability.
Overview symbols
Icon | Description/Function |
|---|---|
| Click: Goes to "Web access" |
|
|
| At least one alarm is active. In systems: At least one assigned plant is in alarm state. Click: Goes to alarm list (active alarms) |
| Plant is online↑. |
| Plant is online↑ using a 3G router. "Cursor": Displays the ICCID number as a tooltip |
| Unclear plant state due to missing data transmission:
The state display is updated once the plant resumes transmission of state. |
| Summary of pending tasks. In systems: At least one assigned plant has a planned or on-going task. |
| Release notes are available. See section "Set up notifications about plant upgrades". |
Upgrade status' column:
'Empty field' | On plants with application set: n application set is available and synchronized with the plant BSP↑. An application set is available and synchronized with the plant BSP↑. The plant does not have an application set. |


 ,
,  ,
, 

